Members: Activity Breakdown
Learn how to compare members by activity time, sessions, and activity mix.
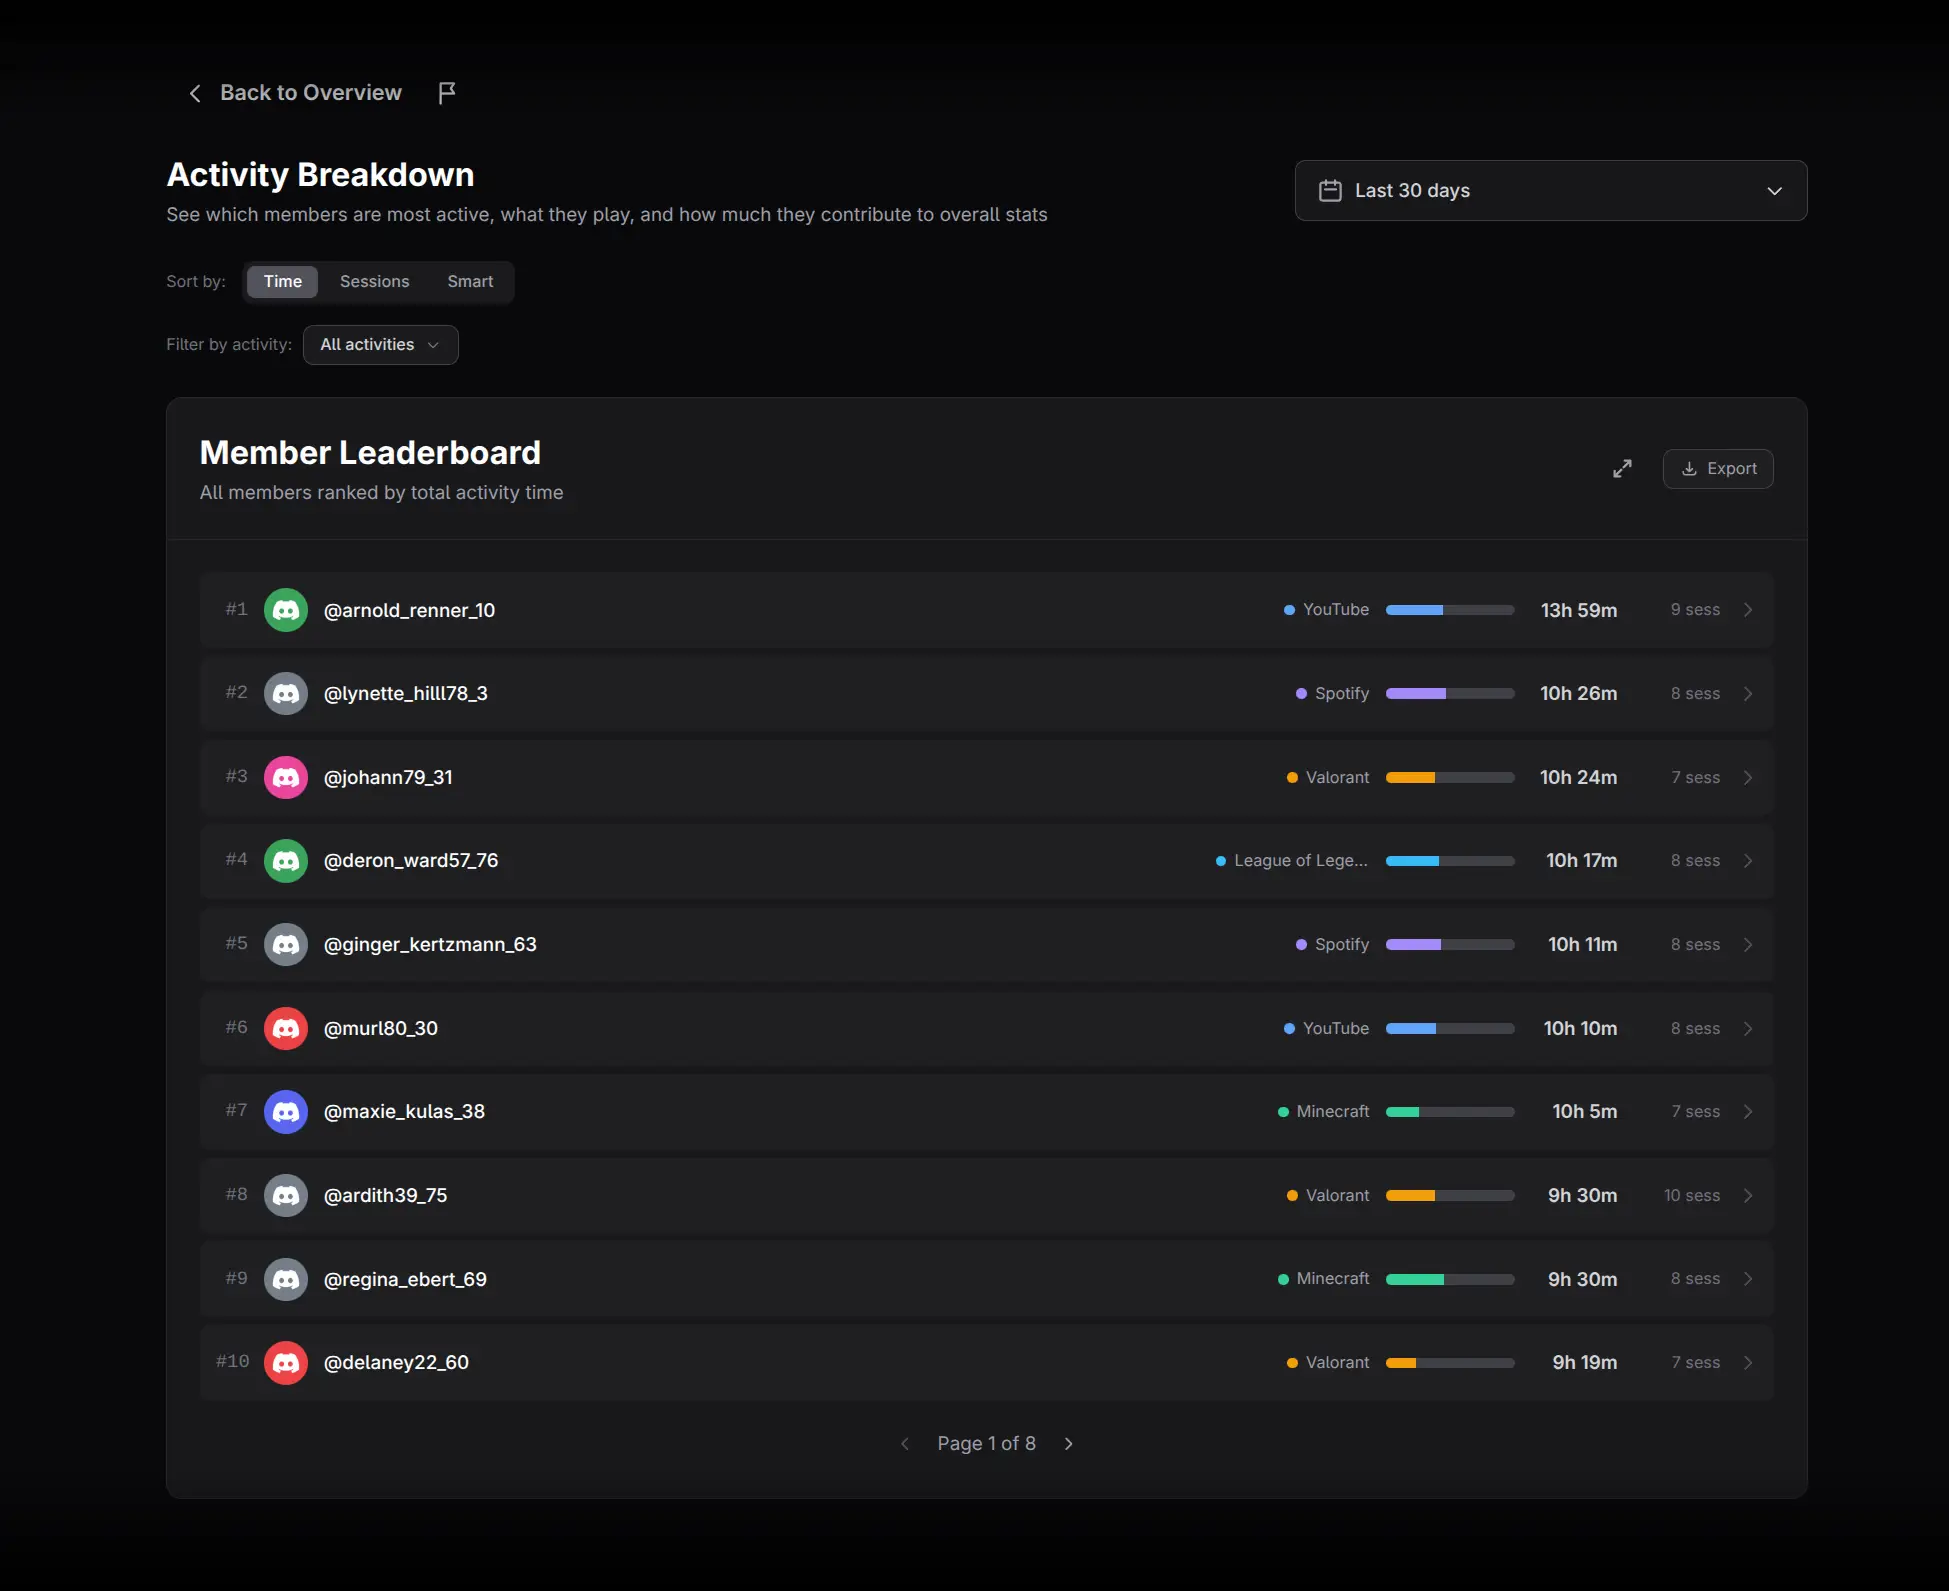
The Activity Breakdown report is the member-level companion to Activities. It answers: who is using each game or application, how much time they spend, and what mix of activities makes up each member's total.
Select the date range
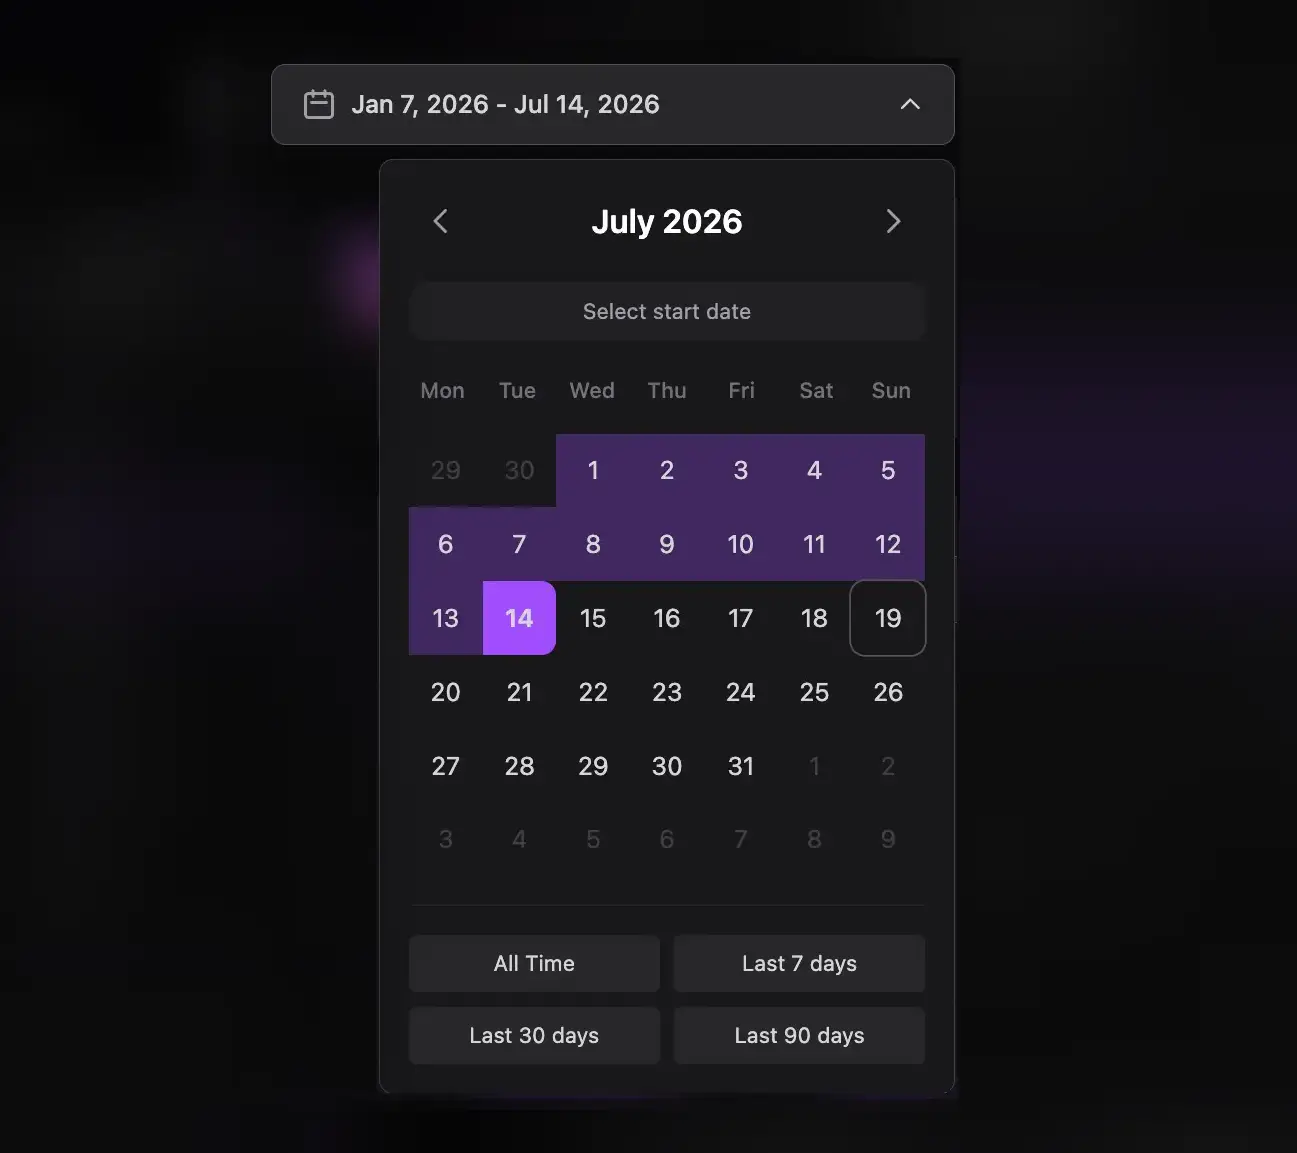
Choose the period to analyze. The page focuses on member composition and ranking rather than a time-series chart, so it does not require a granularity selector.
Choose a ranking method
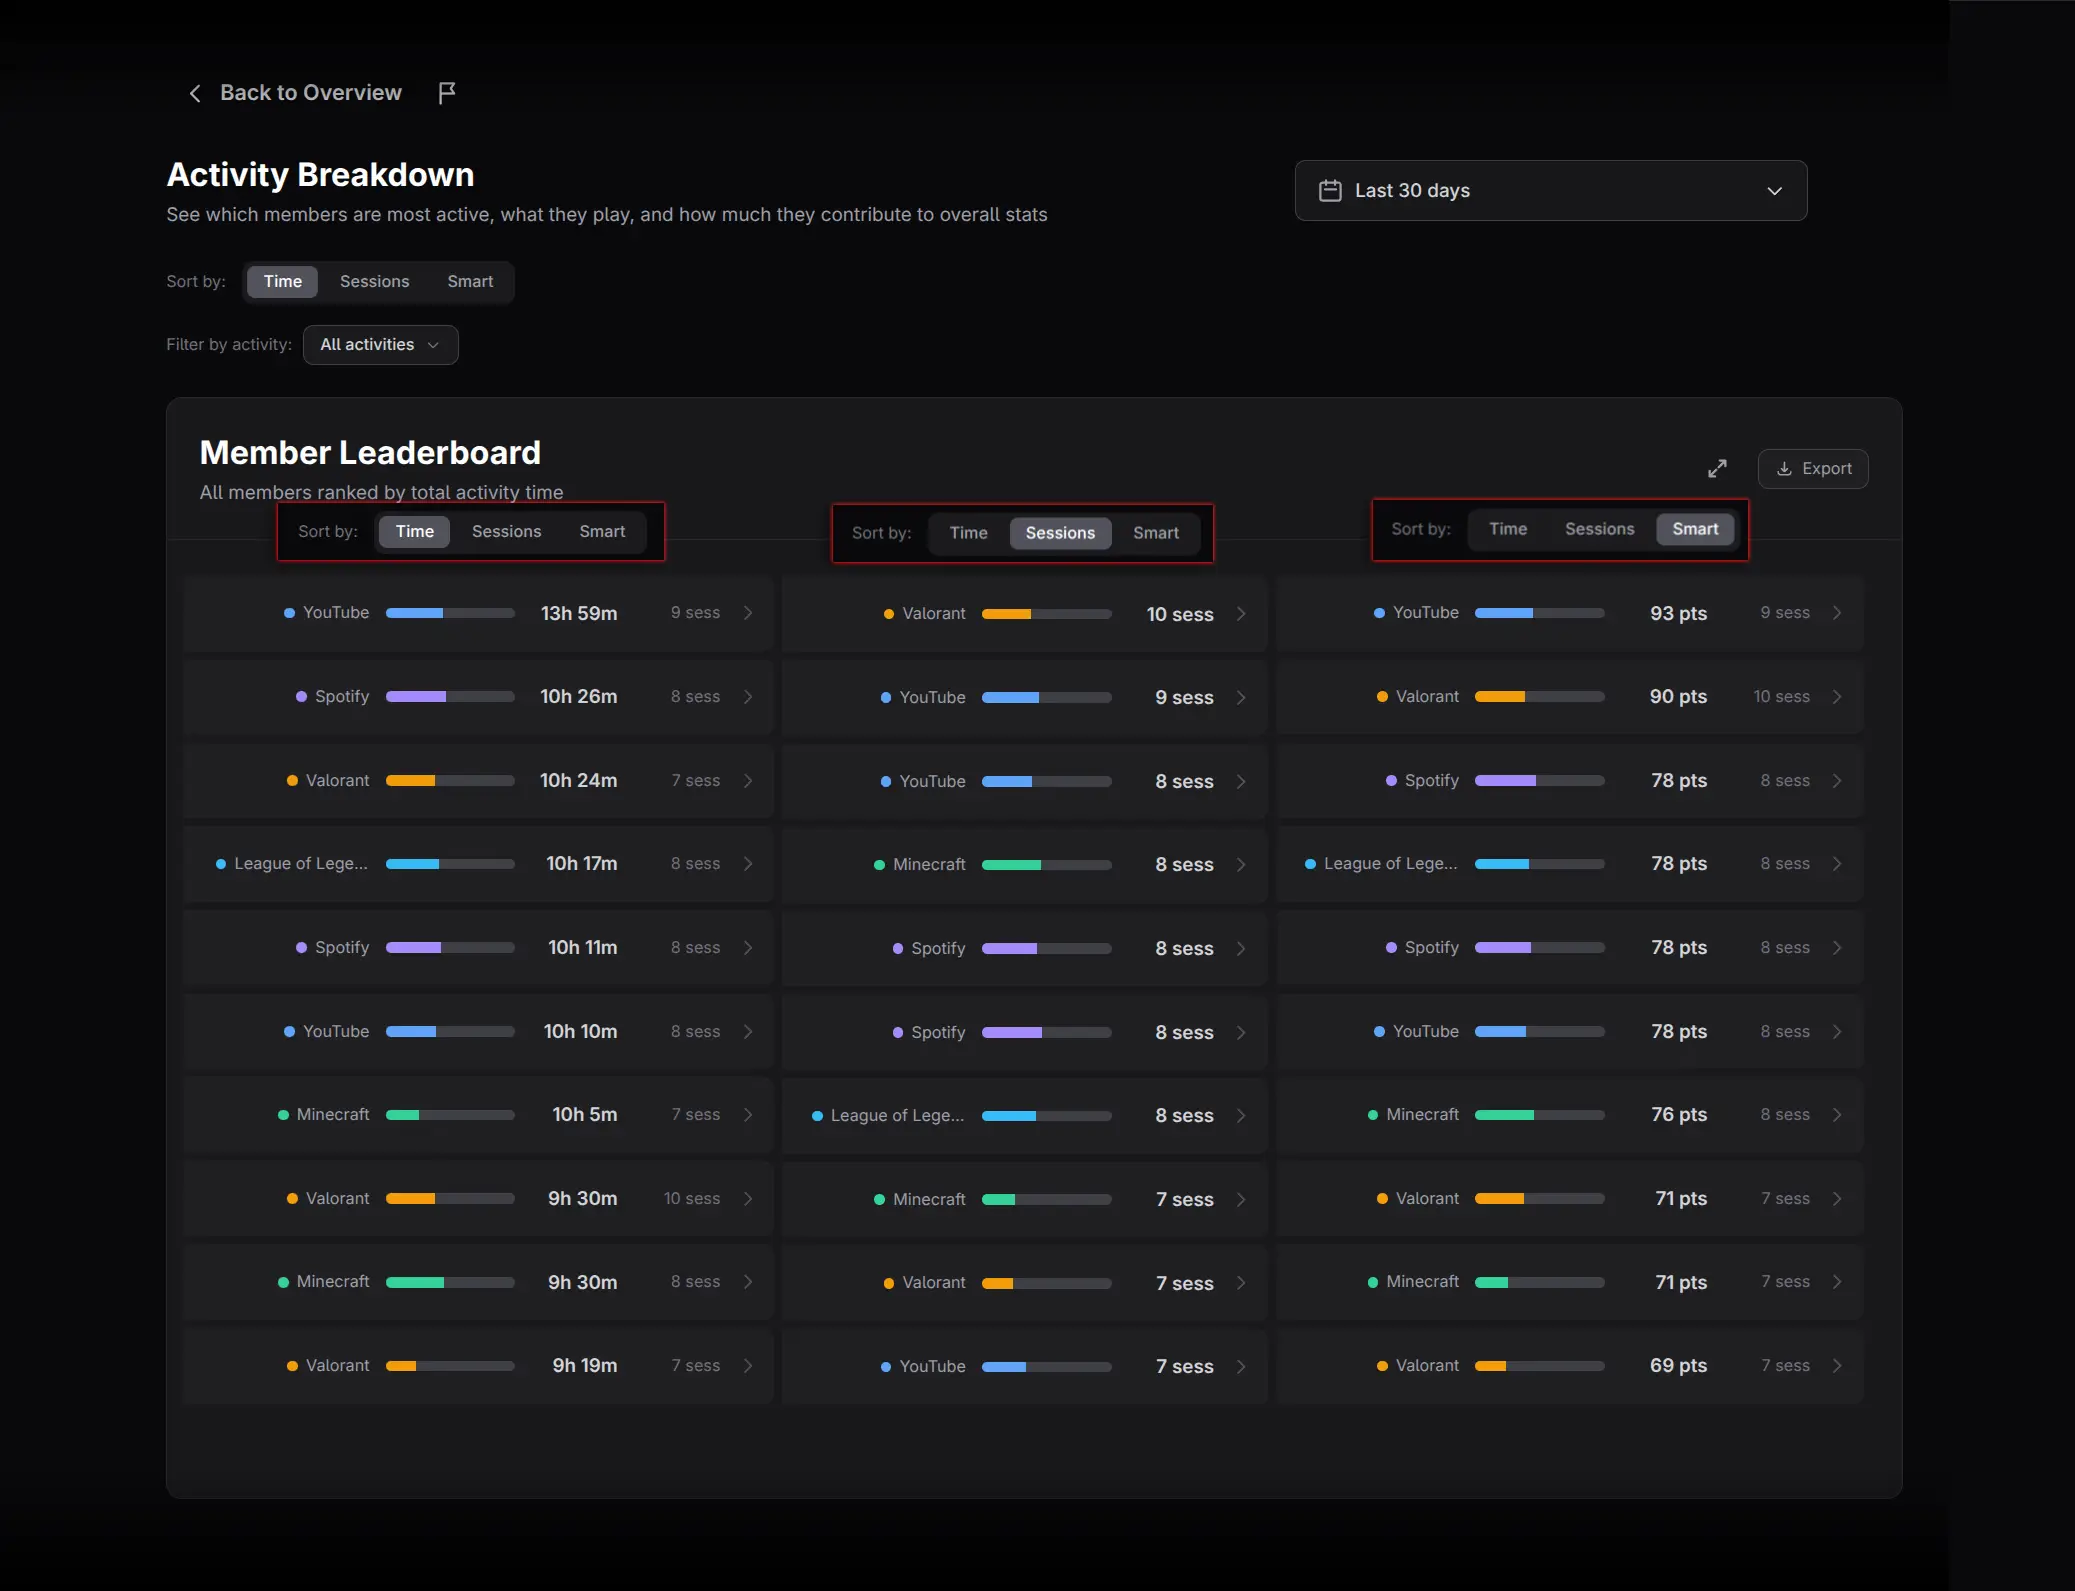
- Time ranks members by total activity duration.
- Sessions ranks by the number of sessions.
- Smart uses a weighted combined score.
Changing the sort can substantially reorder the same members. Time favors depth, while Sessions favors frequency.
Filter by activity
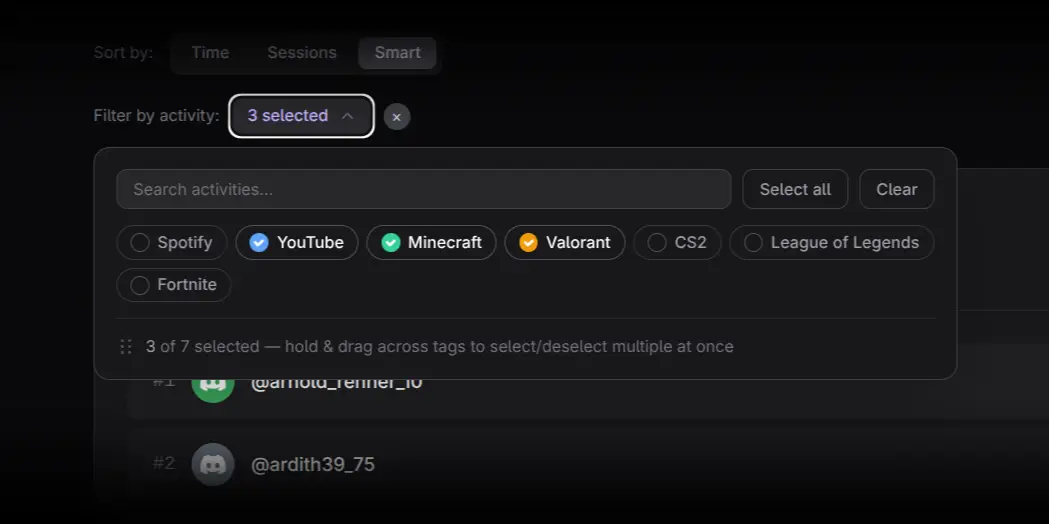
Open the activity filter and select one or more activities. The page then includes qualifying members and recalculates their ranking using only the selected-activity data. This makes the filter analytical rather than merely visual.
Read the Member Leaderboard
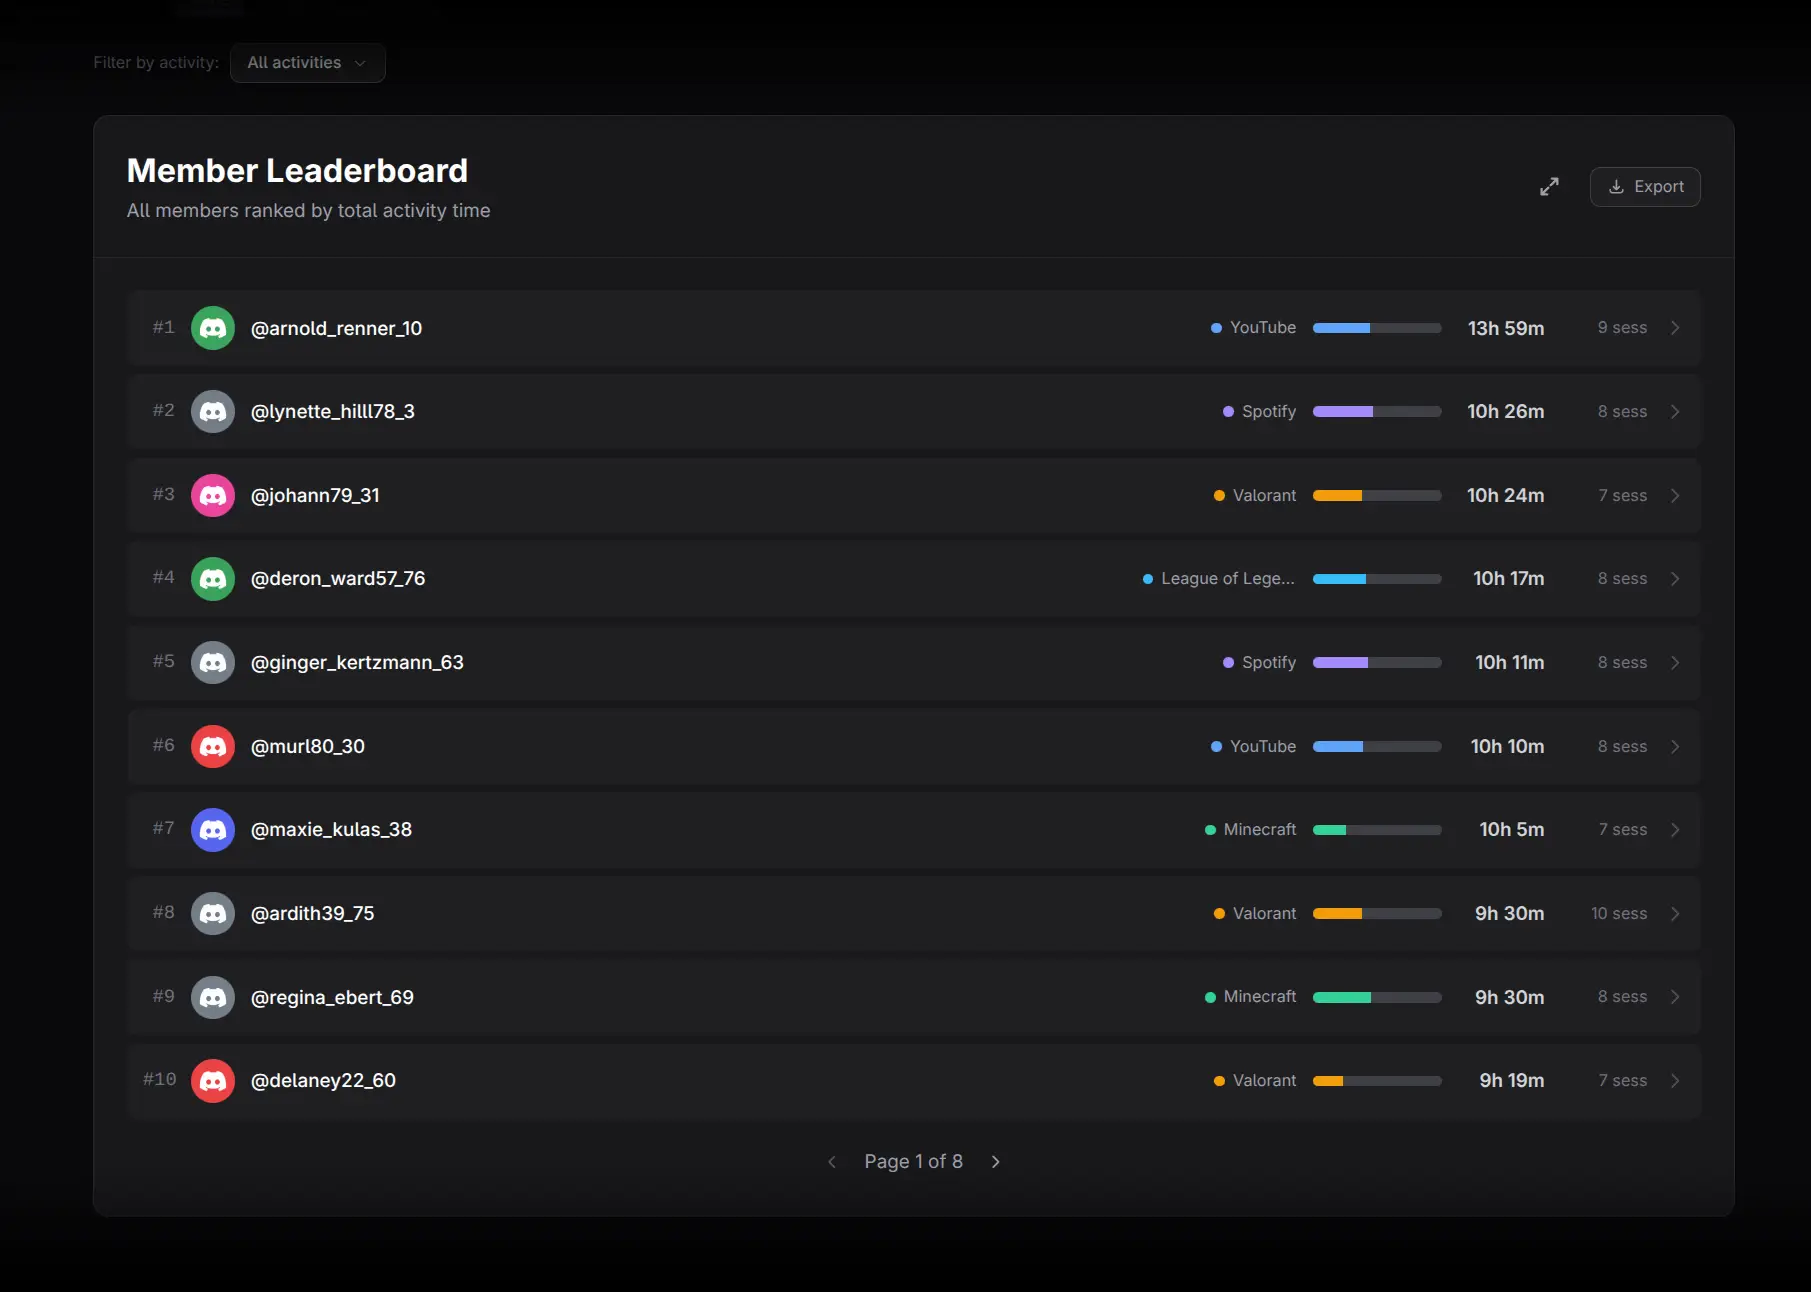
Each member row contains:
- Avatar and member name.
- A segmented composition bar, with one color per activity.
- The total corresponding to the selected sort mode.
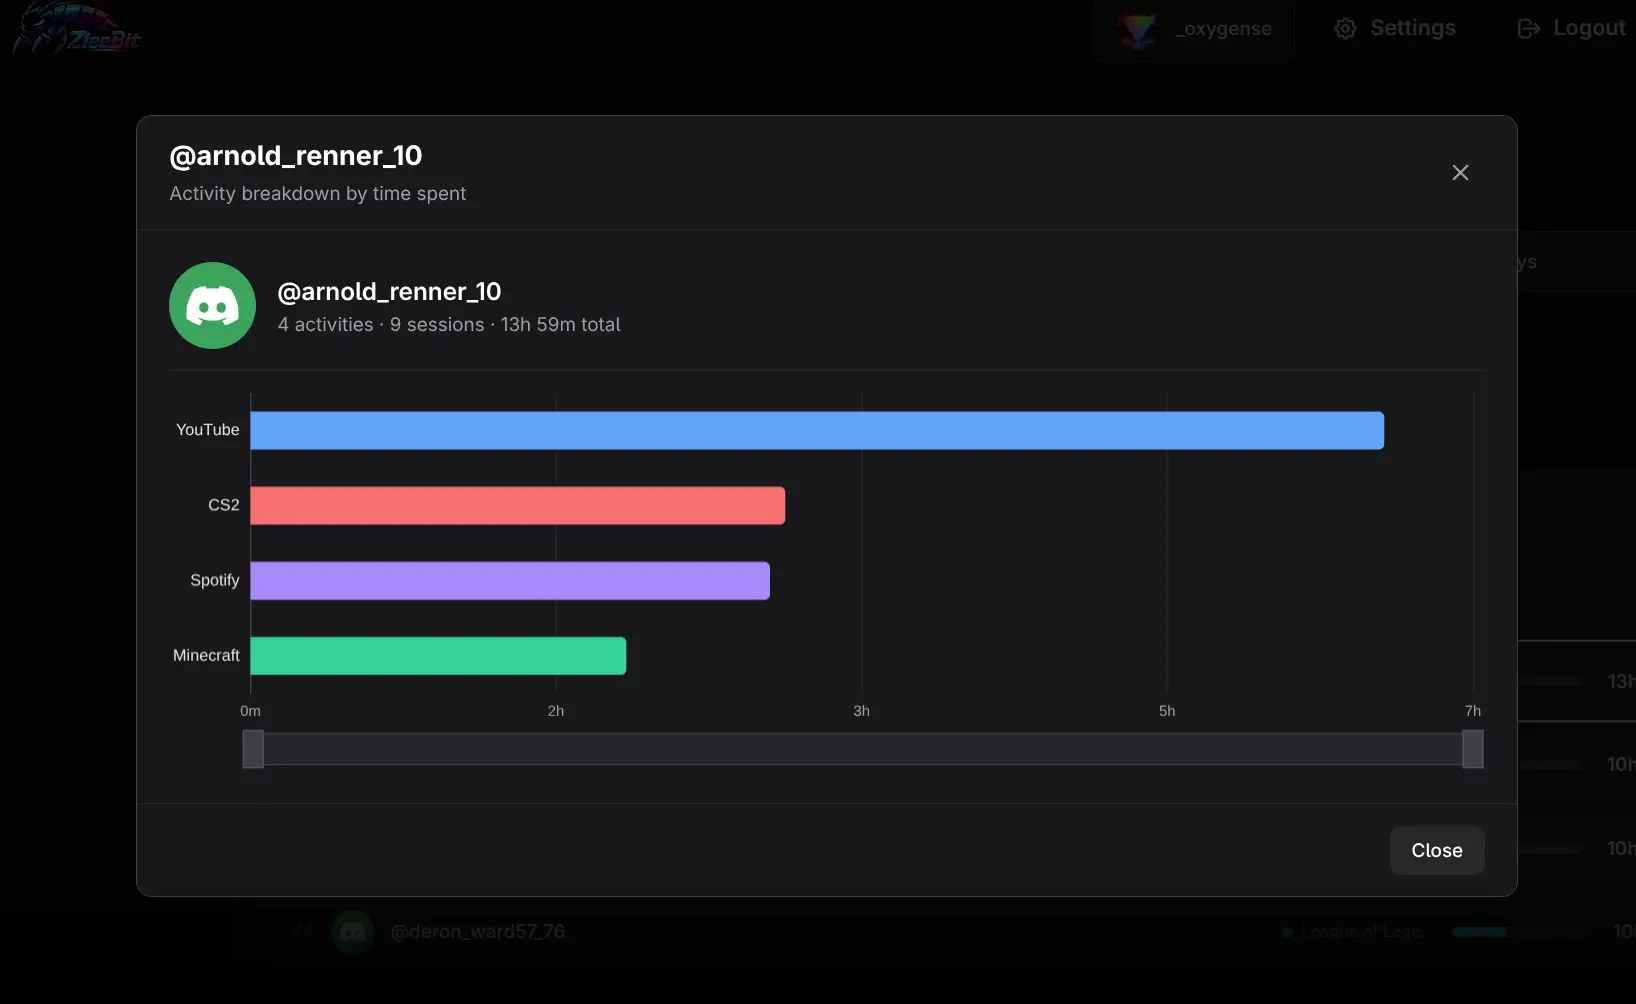
Click a row to open Member Activity Details. The modal shows a horizontal bar breakdown of that member's activities, making it easier to separate a specialist from a broadly active user.
Open the full breakdown chart
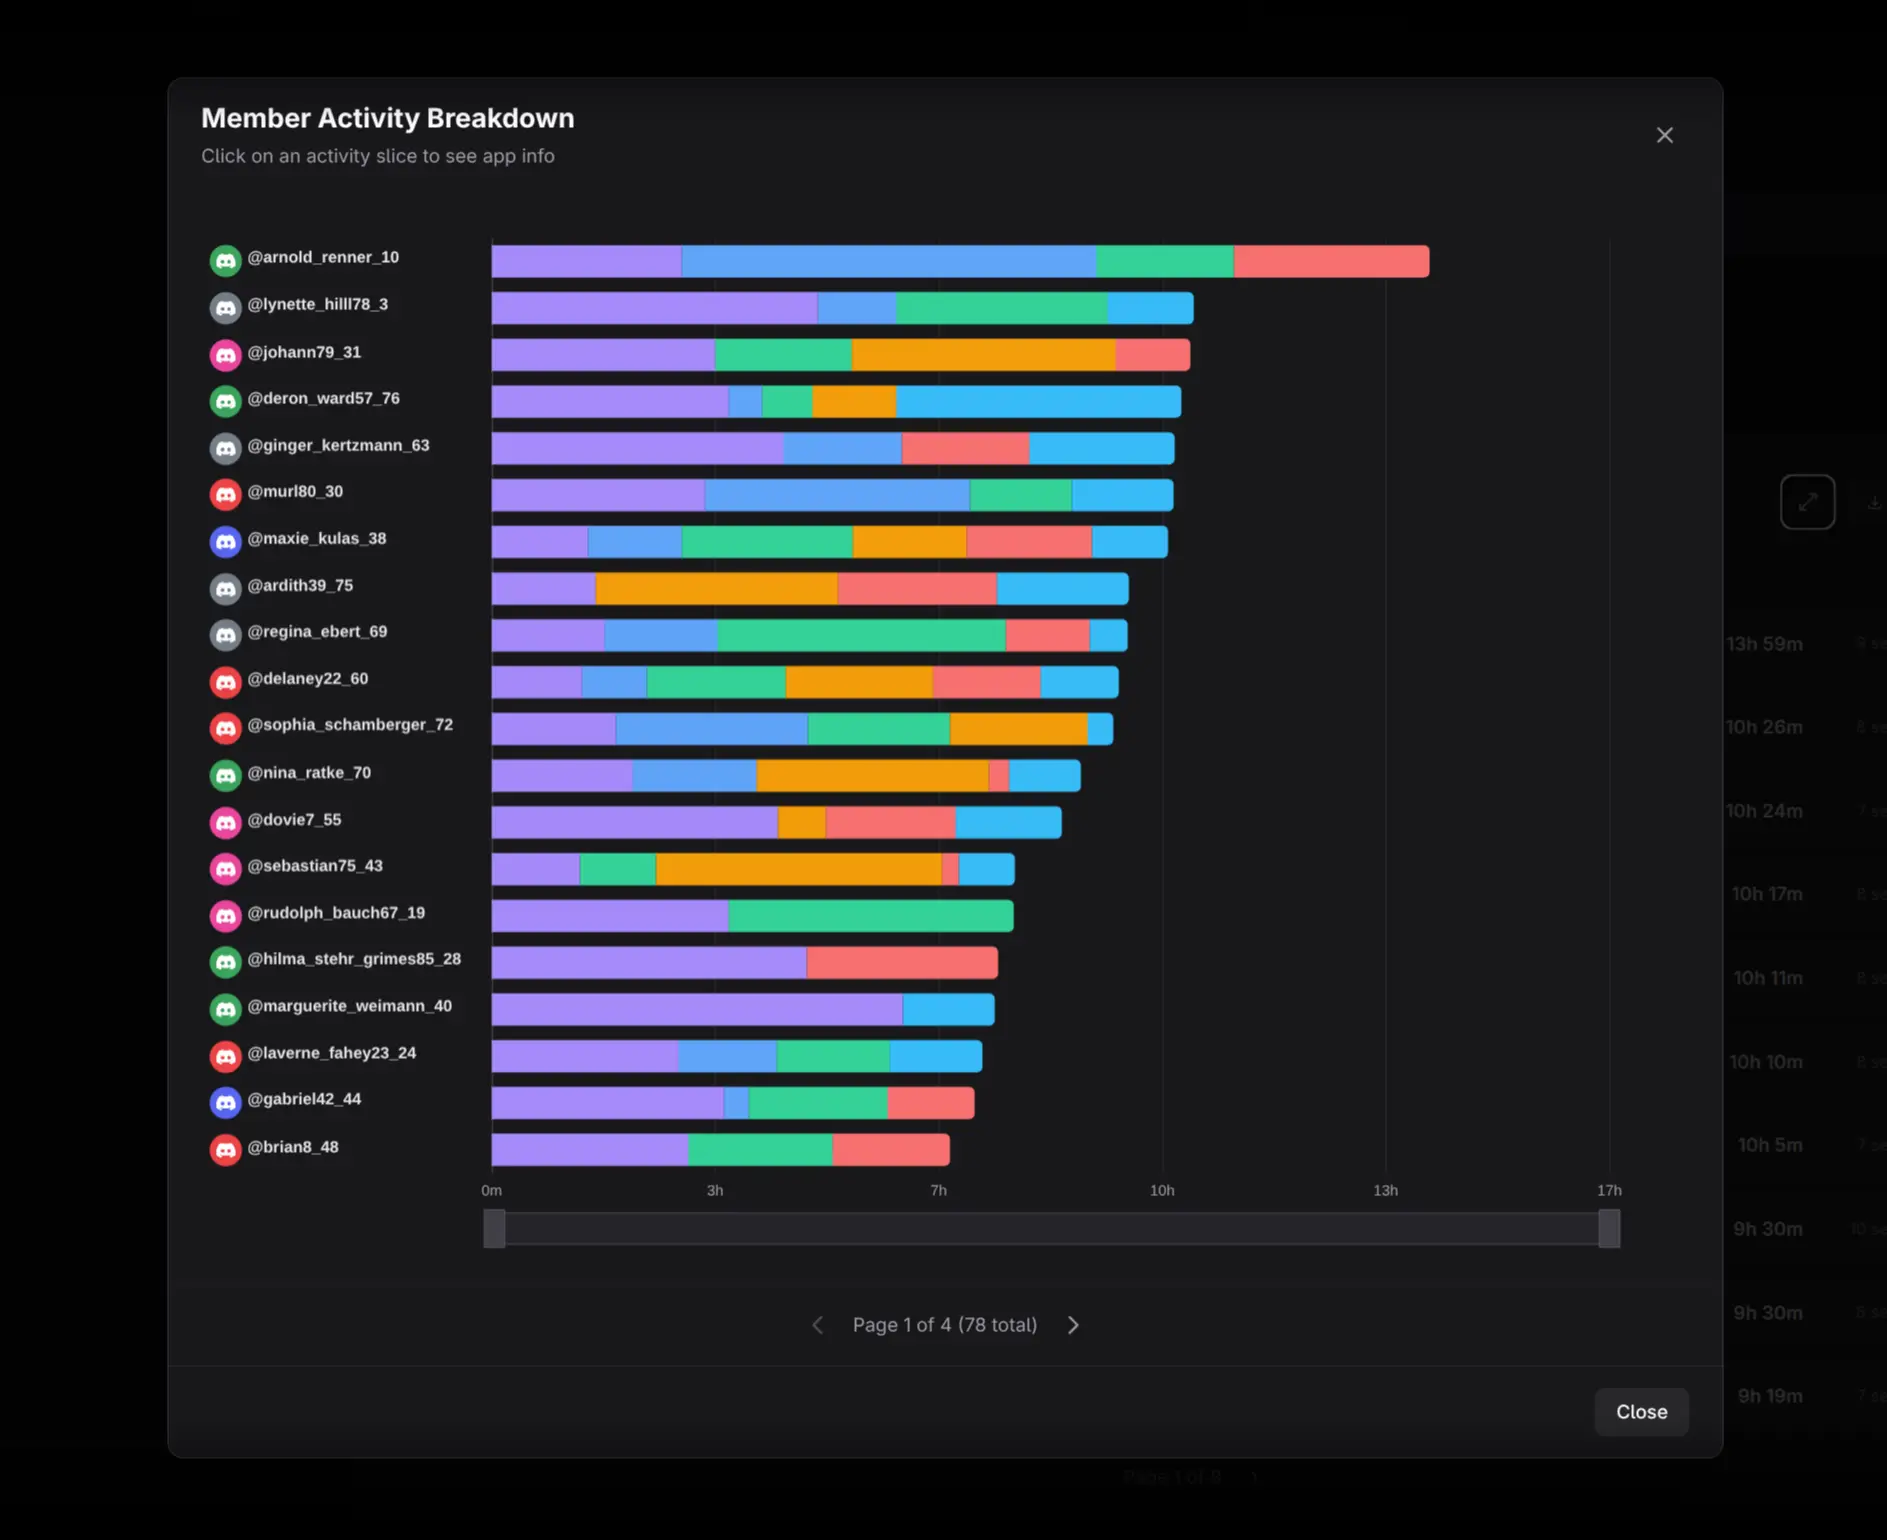
Click View activity breakdown chart or the expand control to open the large stacked-bar view.
- Click a member's name or avatar to open full Member Details.
- Use the back arrow to return to the breakdown.
- Click an activity-colored segment to open Activity Info for that activity, aggregated across the currently filtered members.
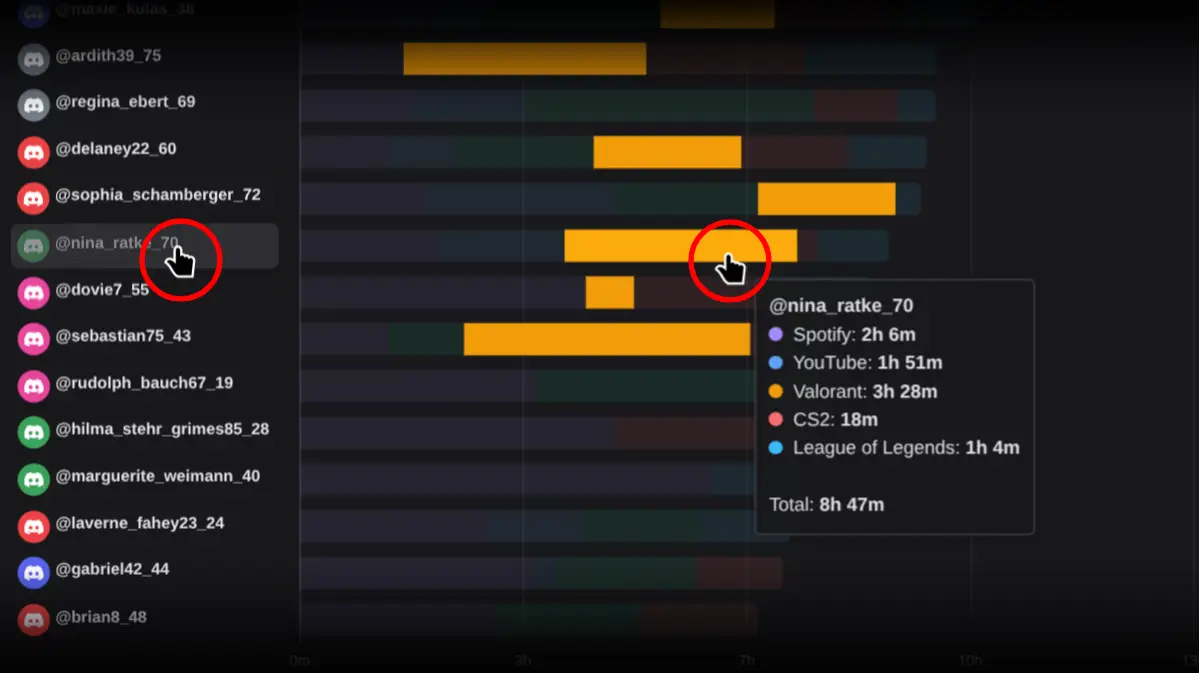
The two click targets answer different questions: the identity area explains the member; the colored segment explains the activity.
Practical workflows
Build an event audience
Filter to the target activity, rank by Time or Sessions, and open member details for the strongest participants. Use the result as an evidence-based audience segment rather than inviting only the overall server leaderboard.
Find cross-interest members
Look for rows with several substantial color segments. These members can bridge activity-specific groups, although the chart alone does not prove social influence.
Compare depth and frequency
Switch between Time and Sessions. A member with high time but few sessions tends toward longer sessions; high sessions with less time suggests frequent short use.
Exporting
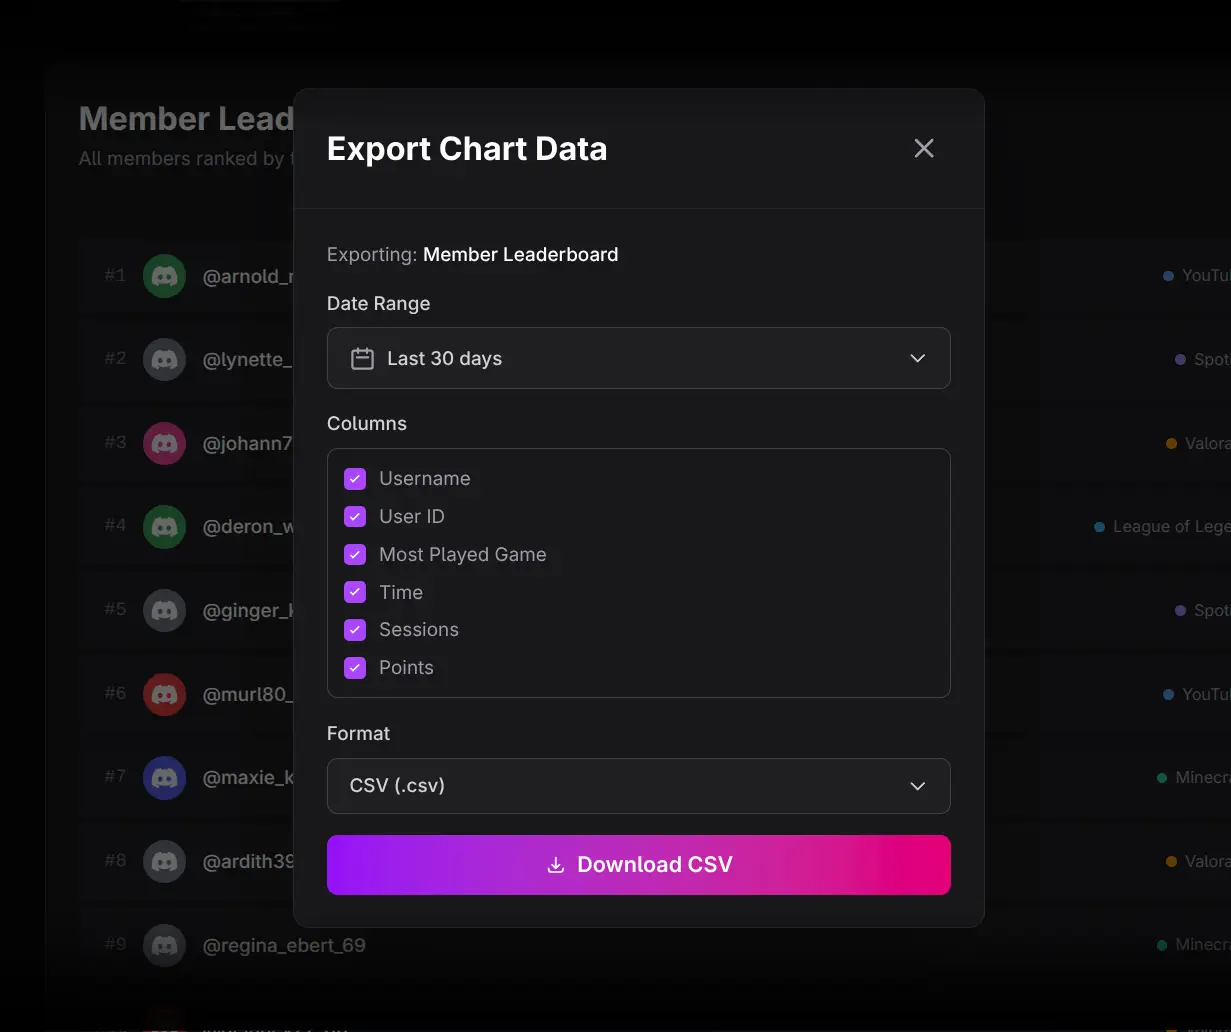
Use the leaderboard Export control to download the member/activity data. Select the required fields and output format in the export dialog.
Interpretation cautions
- The report depends on Discord Rich Presence data.
- Filtered rankings cannot be compared directly with unfiltered totals without noting the scope.
- Smart is a product-defined weighted score.
- Activity duration indicates use, not necessarily active attention throughout the entire session.