Quick Start
Learn how to connect a server, read your first report, and find the right page for what you're trying to answer.
This guide gets you from a freshly connected Discord server to your first real insight in ZleeBit. It does not cover any single report in depth — each report has its own article in this Knowledge Base.
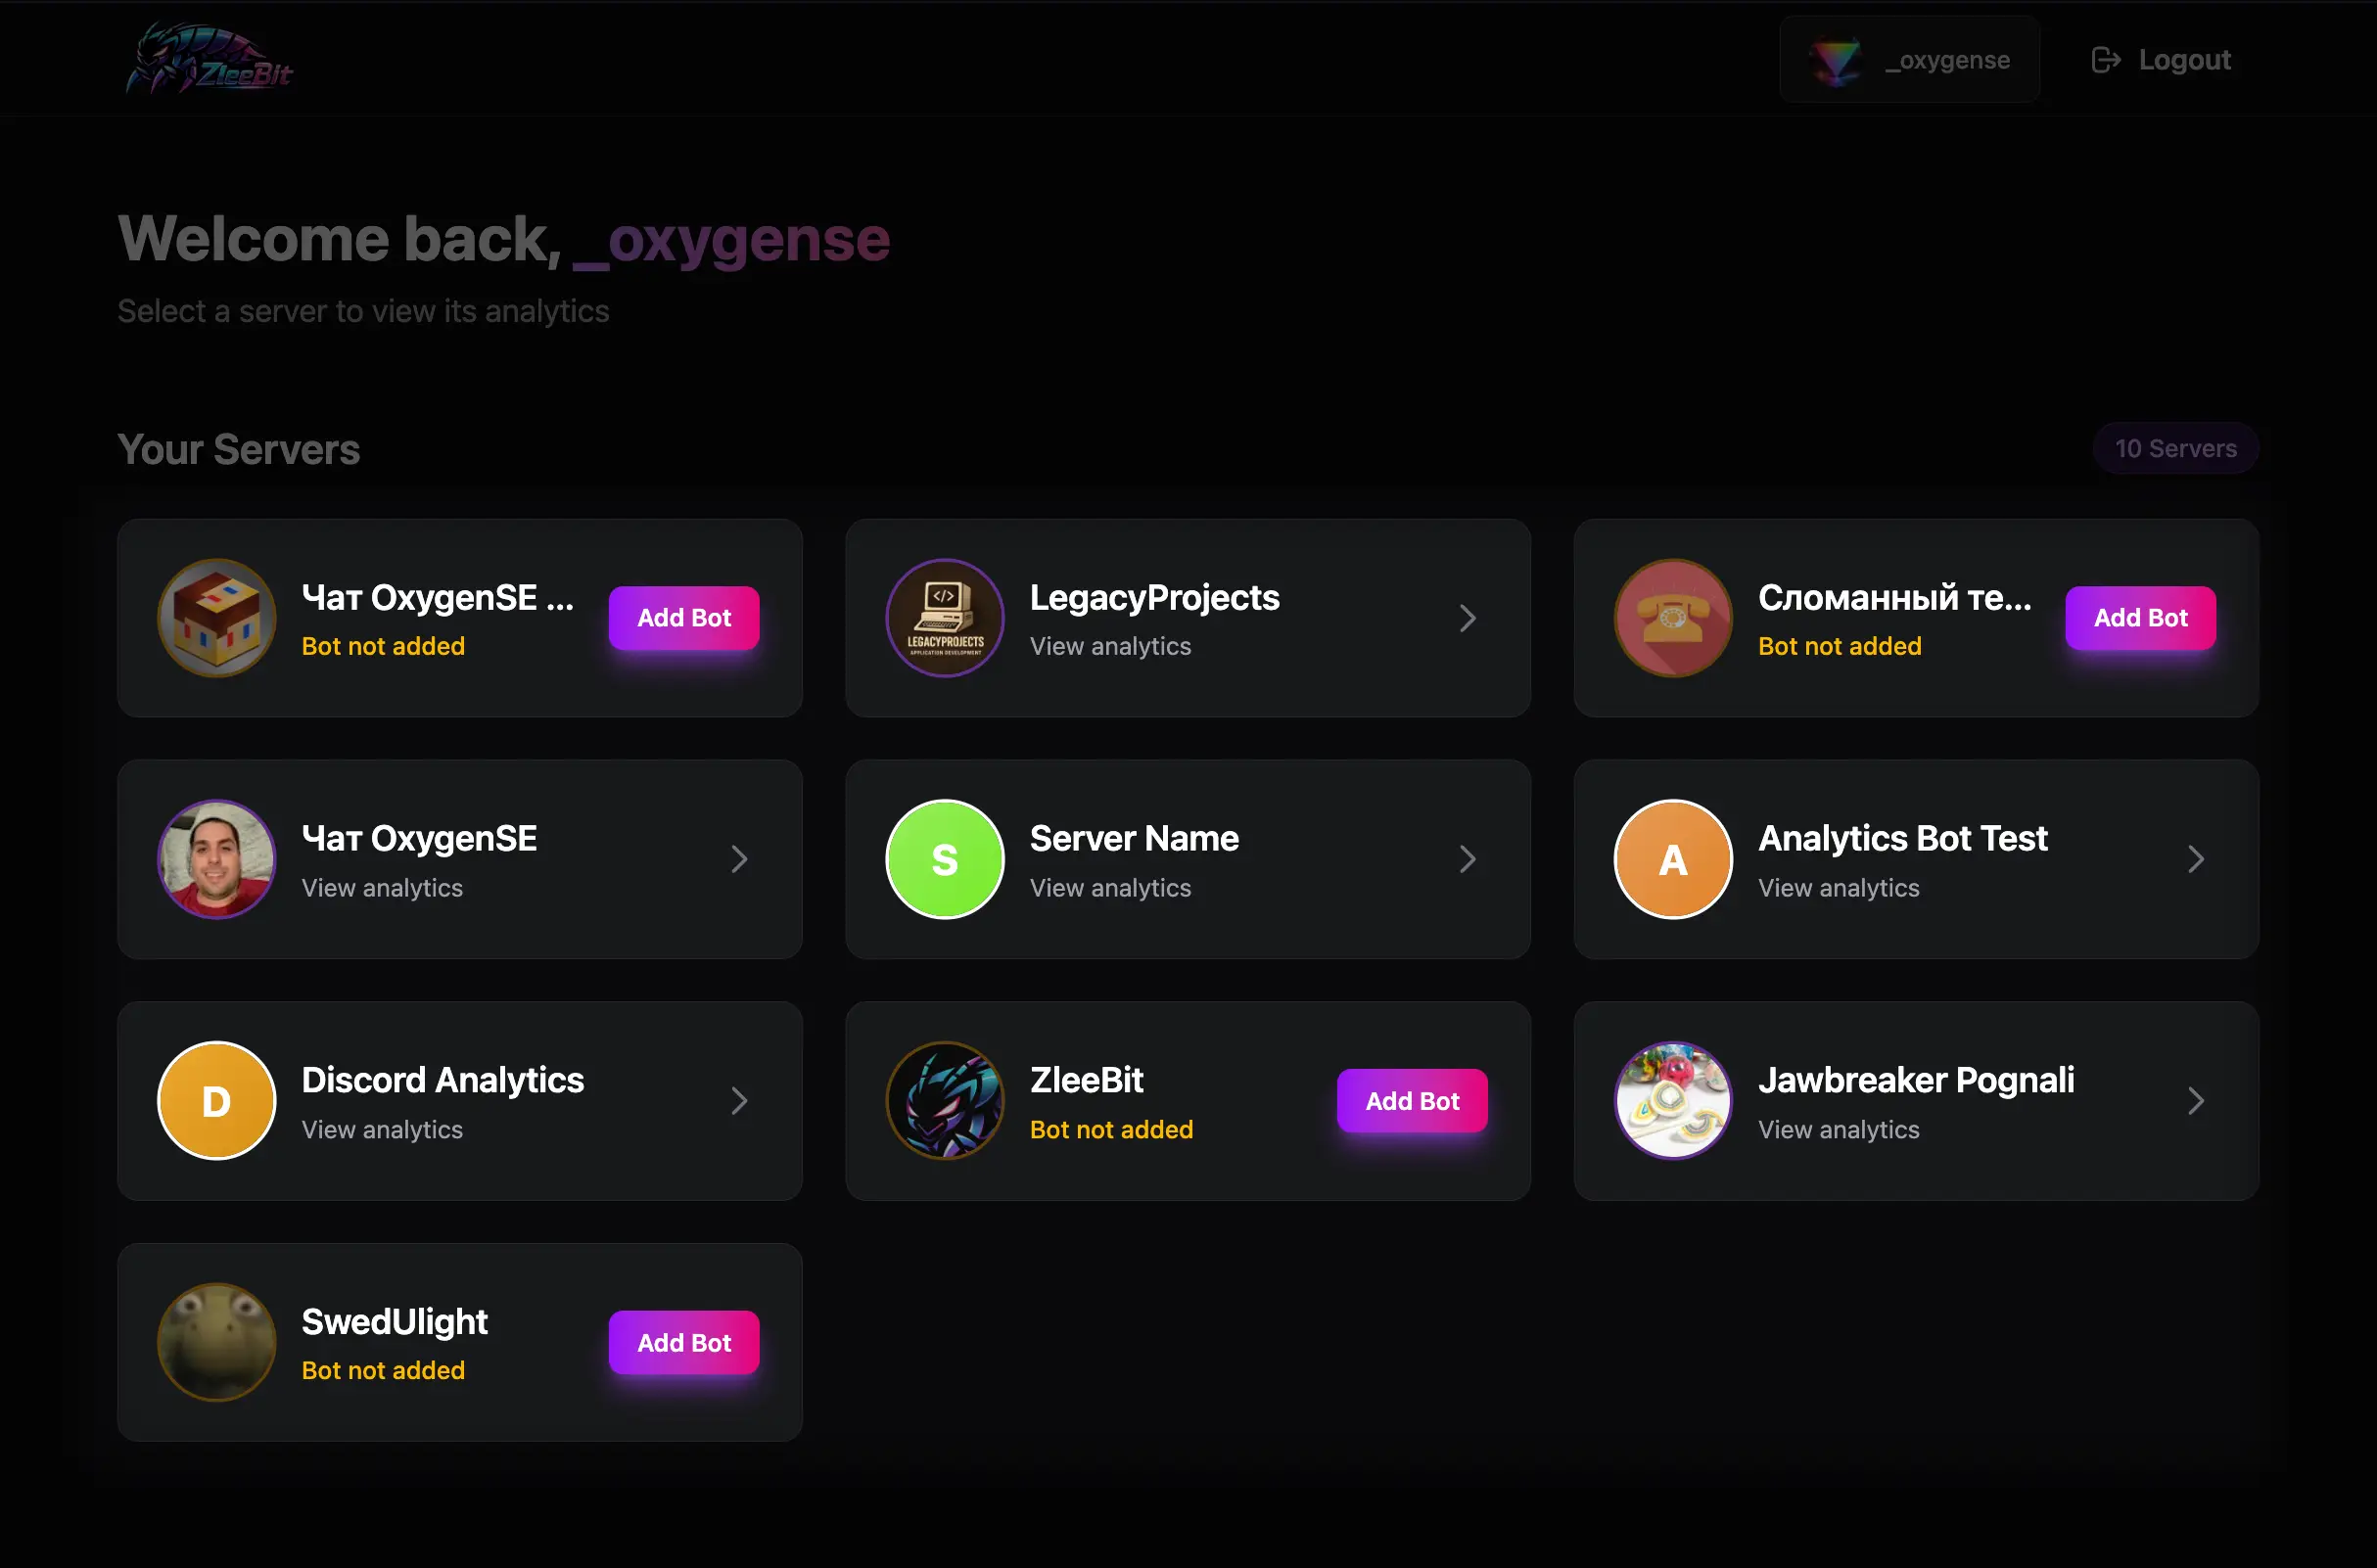
1. Connect your server
Sign in with Discord and add ZleeBit to the server you want to analyze. Once the bot has joined, the server appears on your Your Servers page. Click it to open its dashboard.
Data starts collecting from the moment the bot joins — historical activity from before that point is not available.
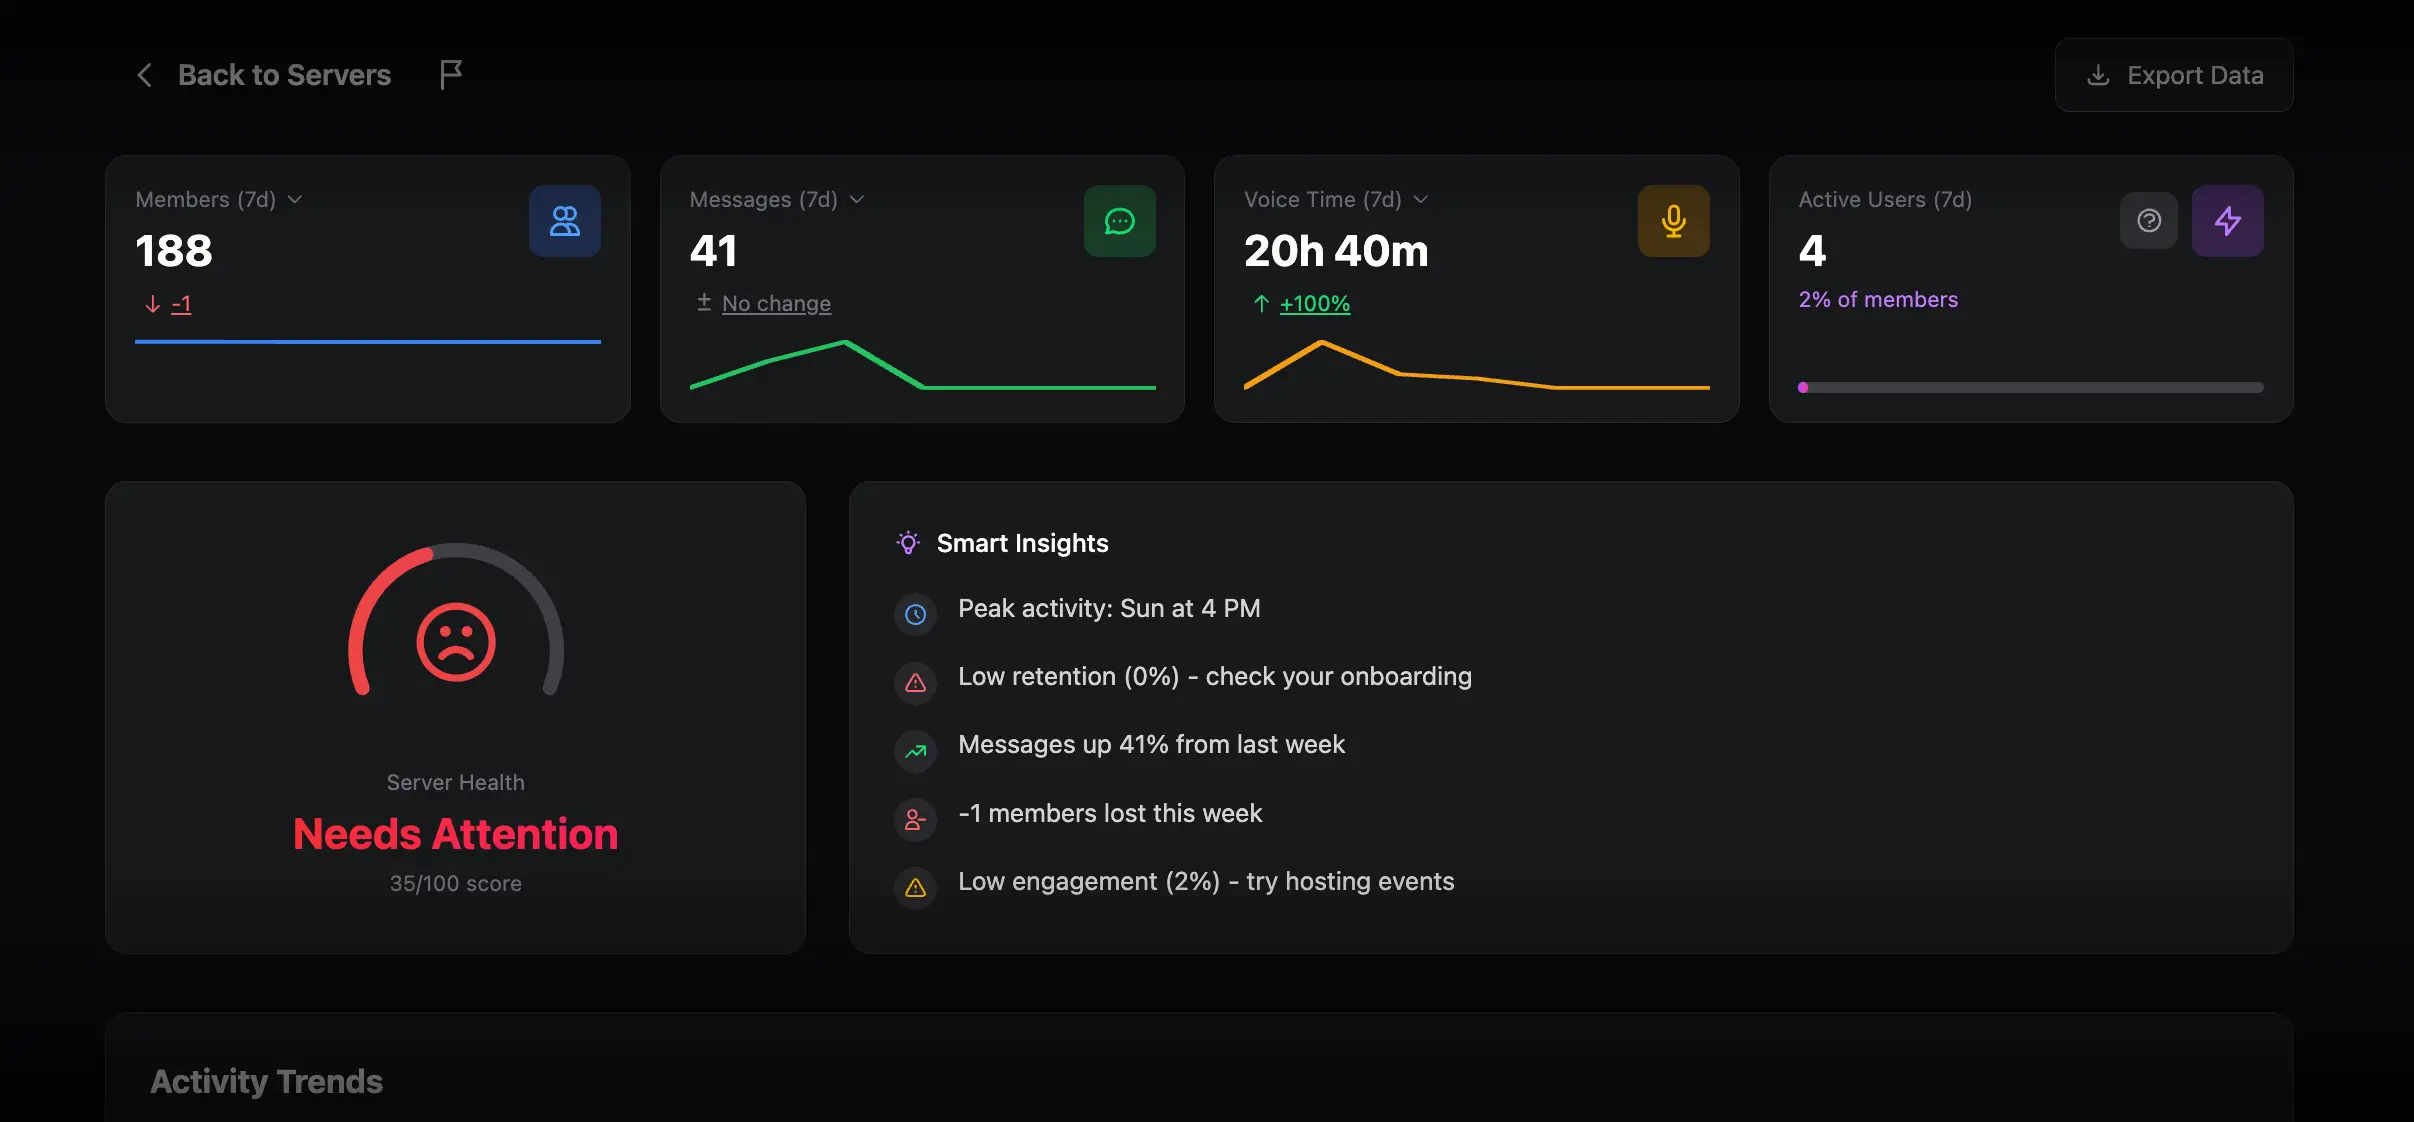
2. Land on the Overview
Every server dashboard opens on the Overview report. It combines member, message, voice, and engagement signals in one place, using a fixed rolling seven-day window. Treat it as a health check, not a deep dive — see the Overview article for exactly what each card and chart means.
3. Find the right report for your question
The sidebar groups every report by topic. Pick based on what you're trying to learn:
- Growing or shrinking? → Members: Growth
- Who's inviting people, and are they sticking around? → Members: Invites
- When is the server actually online? → Members: Presence
- Need a filterable, all-time member table? → Members: Insights
- What games or apps do members use? → Members: Activities
- How much is the server chatting, and where? → Messages: Activity
- Who's active in which periods? → Messages: Activity Timeline
- Is participation returning week over week, or churning? → Messages: Activity Stability
- How many distinct people are chatting, not just how many messages? → Messages: Chatting
- How fast do new members send their first message? → Messages: Onboarding Activity
- How much voice activity is there, and who drives it? → Voice: Activity and Activity Timeline
- How active is the mod team, and what are they moderating? → Moderators: Message Activity, Message Moderation, and Bans & Unbans
4. Use dates, exports, and drill-downs consistently
A few controls behave the same way across almost every report:
- Most reports (outside Overview) have a date range picker and a granularity selector (day/week/month/year) near the top.
- Clicking a chart value, a metric card, or a table row almost always opens a modal with the underlying member- or period-level detail.
- Export Data is available on most reports to download the current view as CSV, Excel, or Google Sheets.
Where to go next
Start with Overview if you haven't already, then open whichever specialized report matches the question you're trying to answer.