Presence
Learn how to identify recurring online periods, concurrent-online peaks, and members with strong presence activity.
The Presence report shows how many members were Online, Idle, Do Not Disturb, or Offline each hour. It helps identify when the community is available, not just when members send messages.
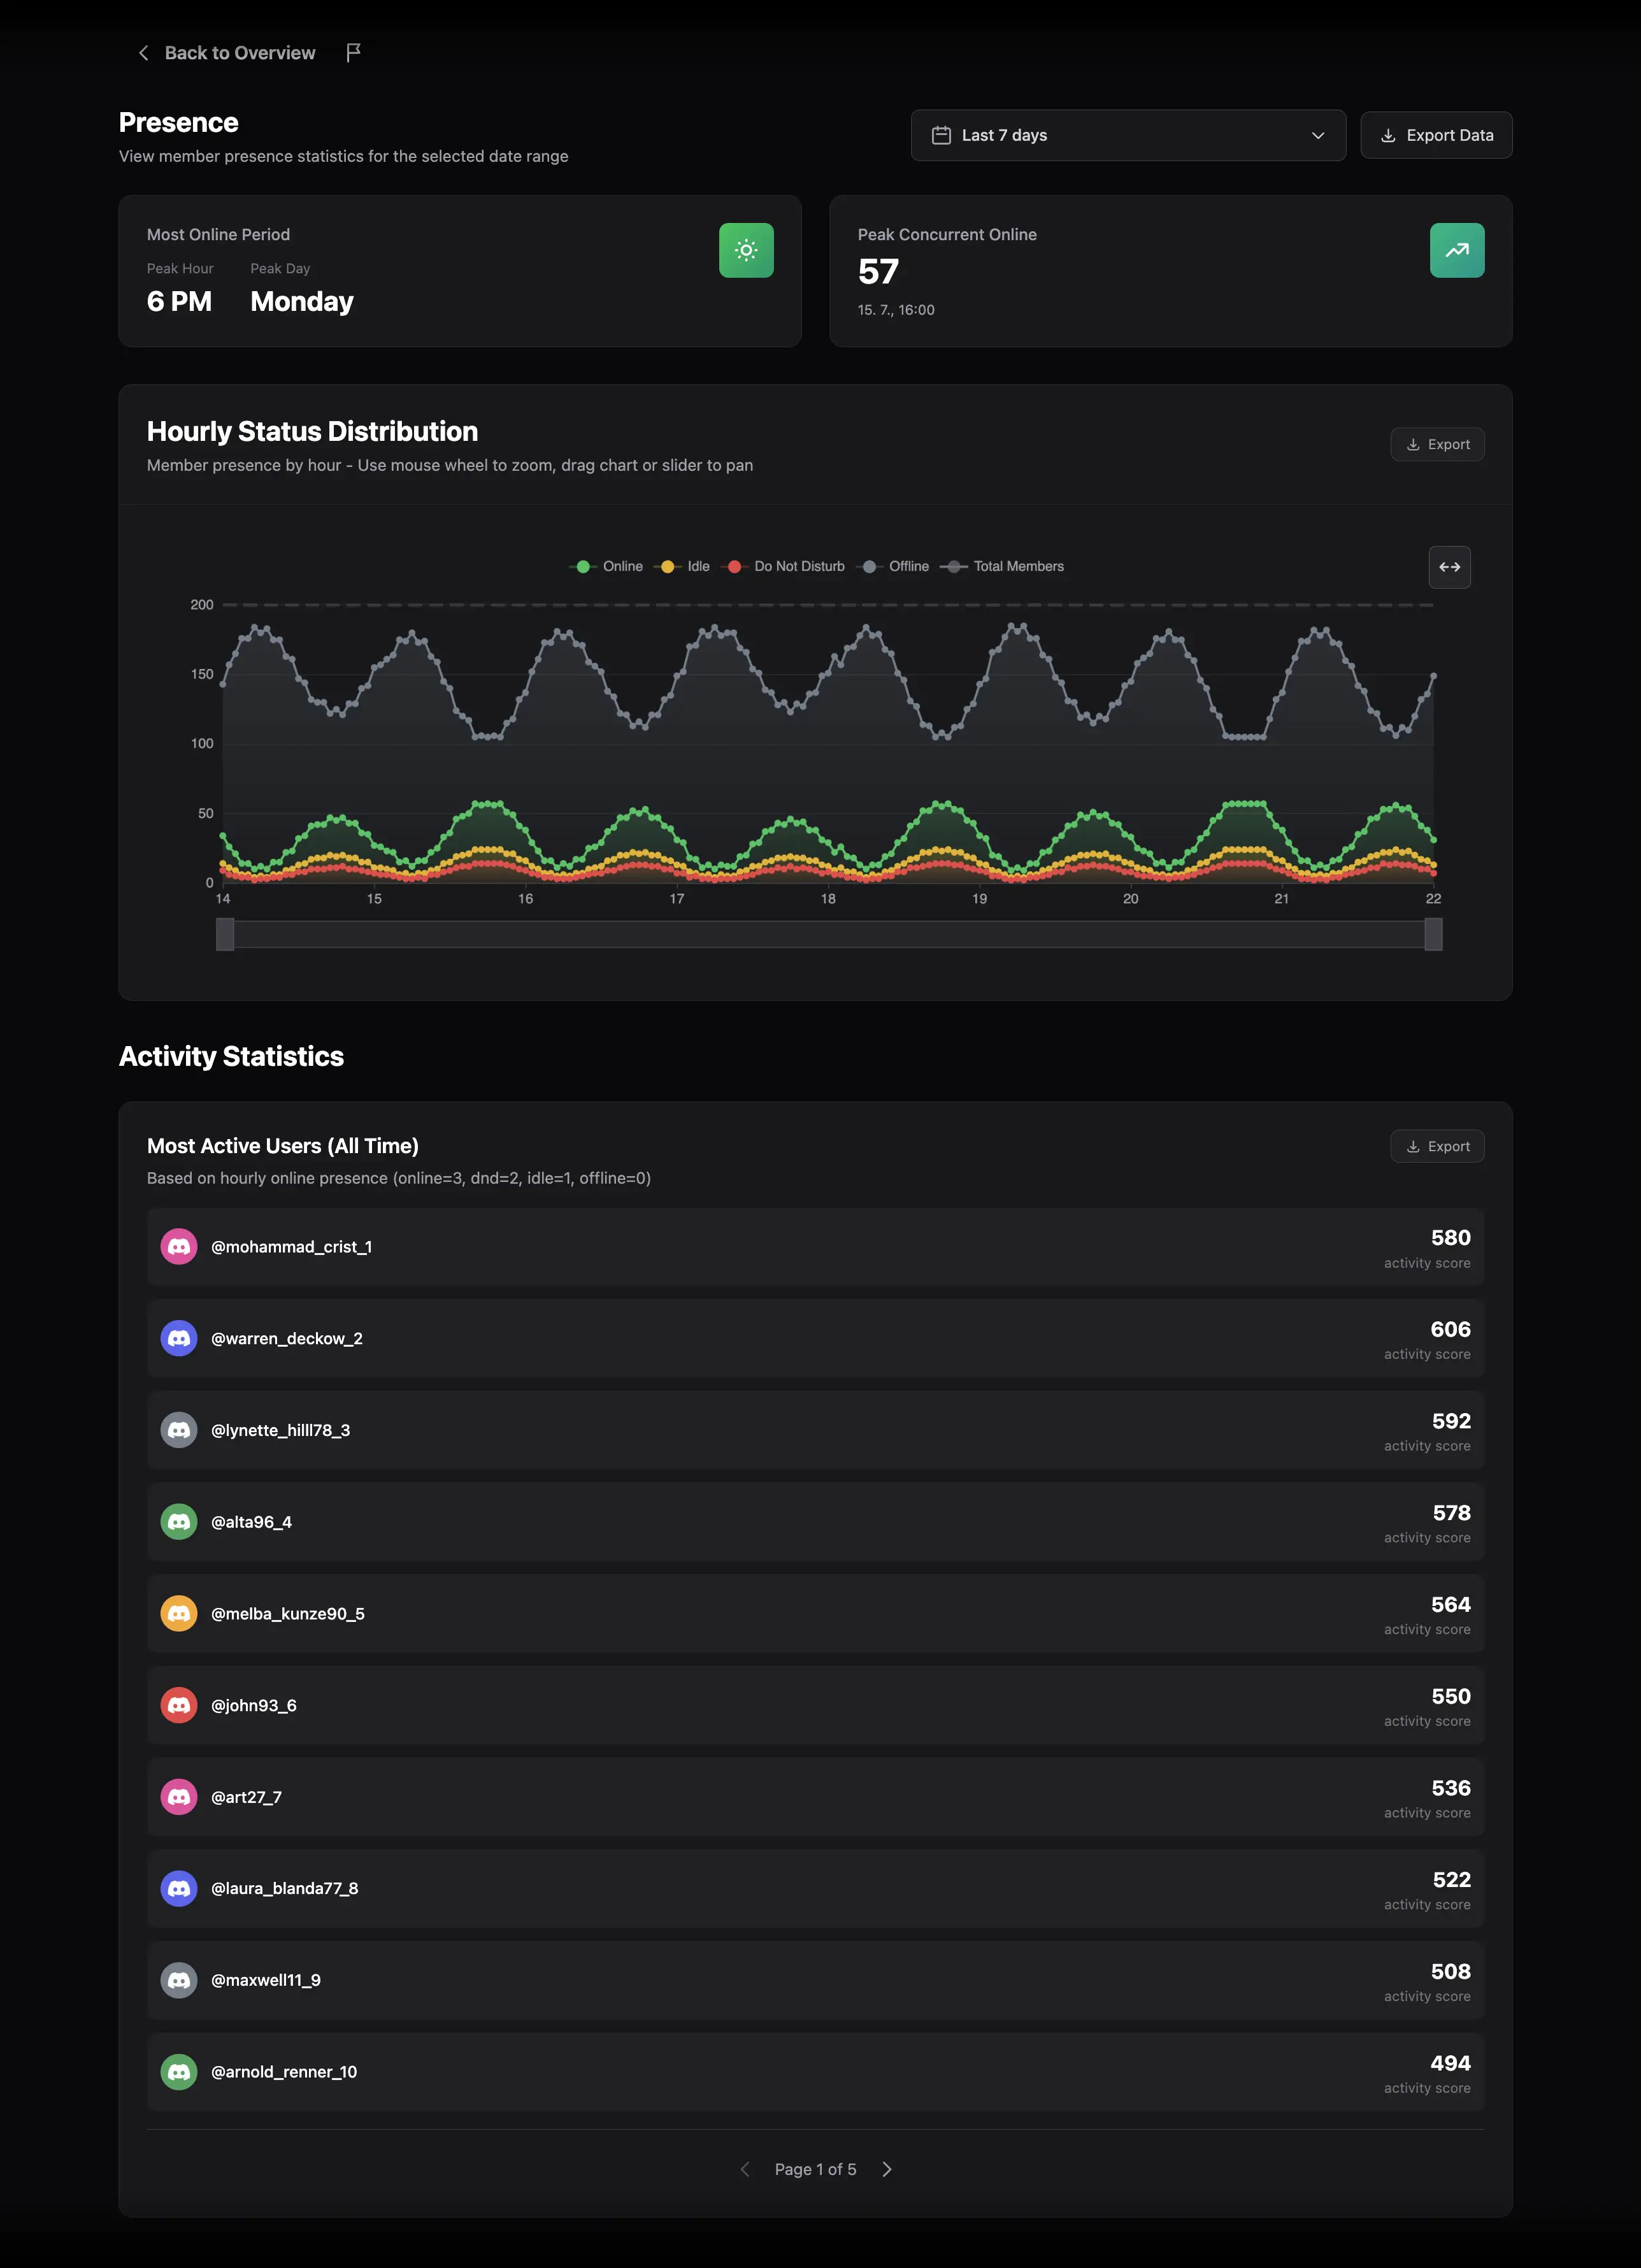
Select the period
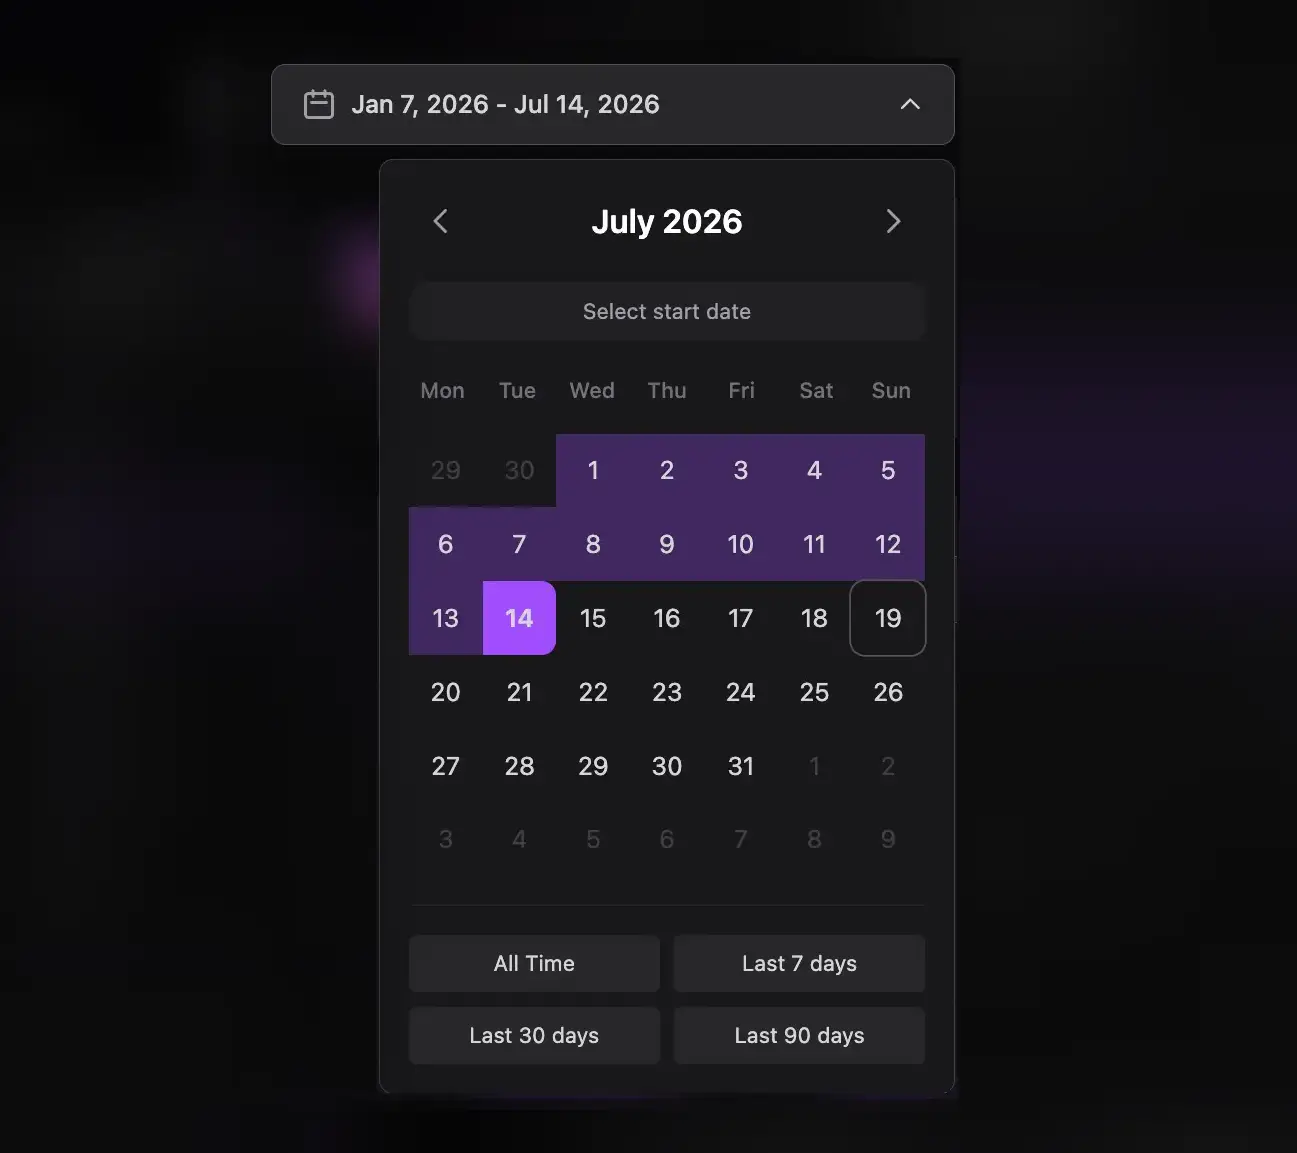
Choose a date range from the date picker. Presence is always hourly, so there is no granularity selector.
Read the summary cards
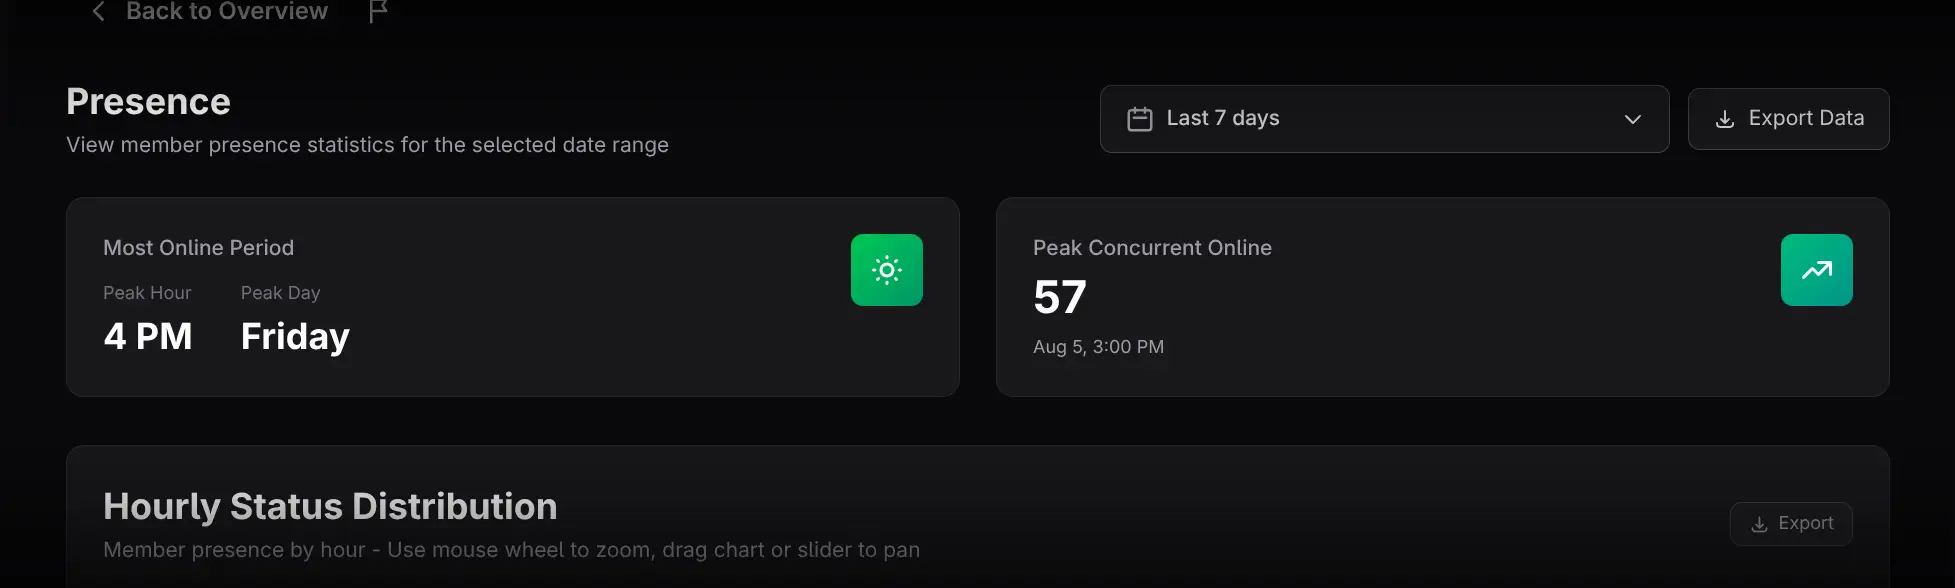
- Most Online Period shows the hour of day and day of week with the strongest average online presence in the selected range.
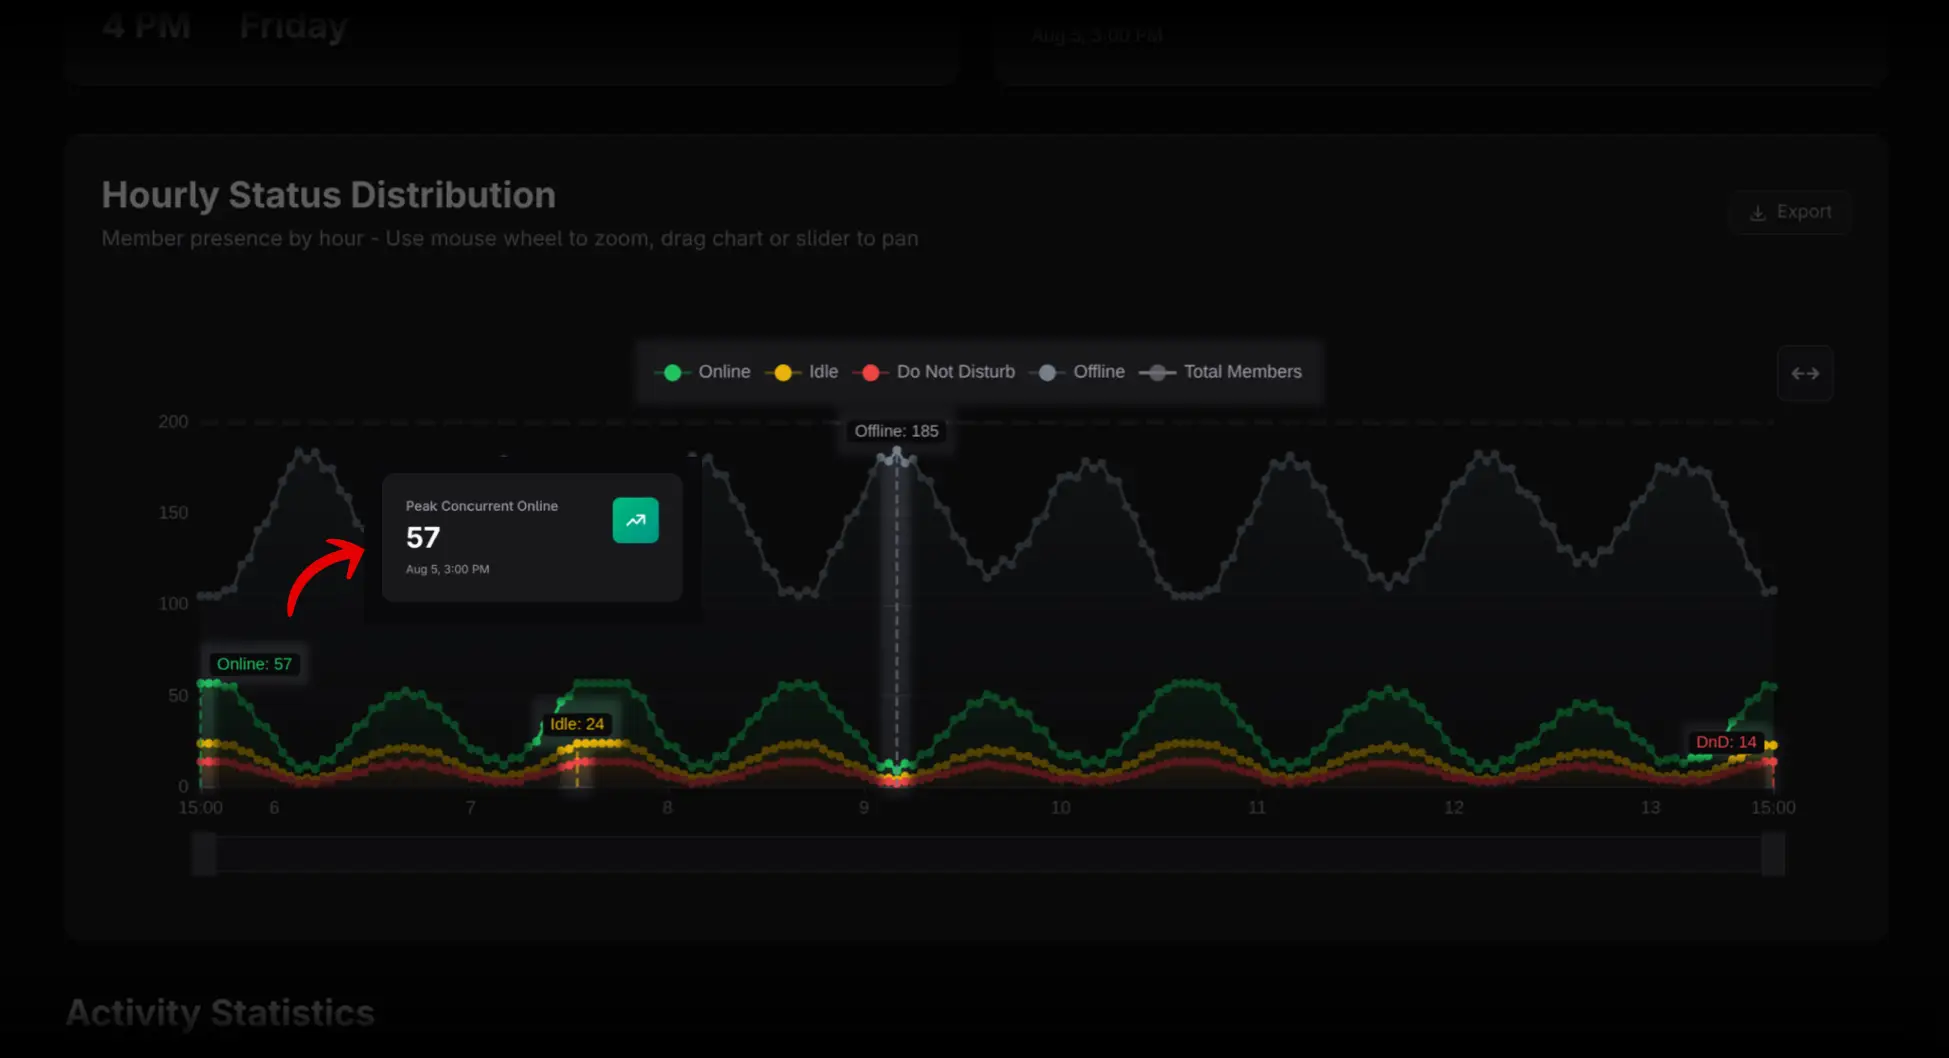
- Peak Concurrent Online shows the single highest observed online count and its exact timestamp.
The first metric describes a repeatable pattern; the second describes one maximum moment. Use both before scheduling an event.
Use Hourly Status Distribution
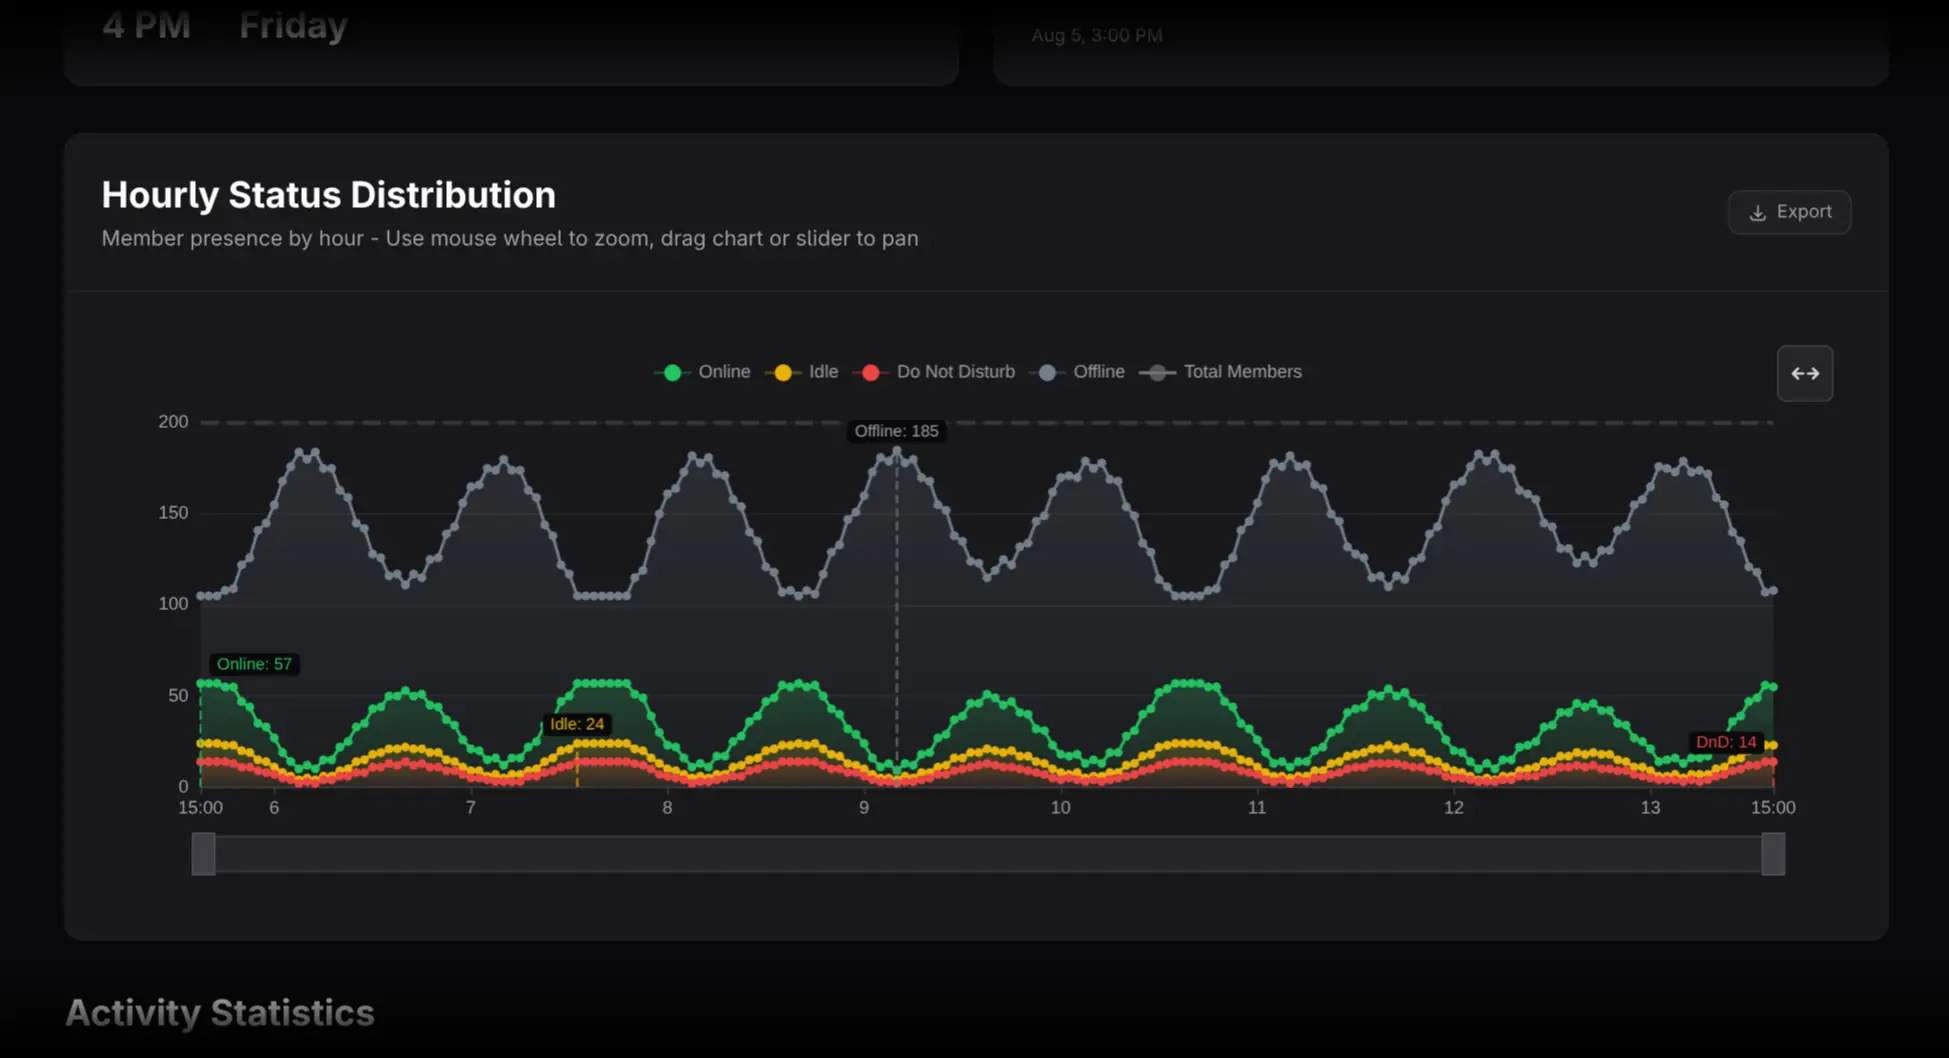
The chart contains five series: Online, Idle, Do Not Disturb, Offline, and Total Members.
- Click legend items to show or hide series.
- Hover to inspect hourly values.
- Zoom or drag to focus on a shorter interval.
- Compare the peak marker lines for each status.
- Distinguish observed data from faded or dashed padding before tracking started or after the current time.
The chart does not open member lists when clicked. It is designed for time-pattern analysis.
Review Most Active Users
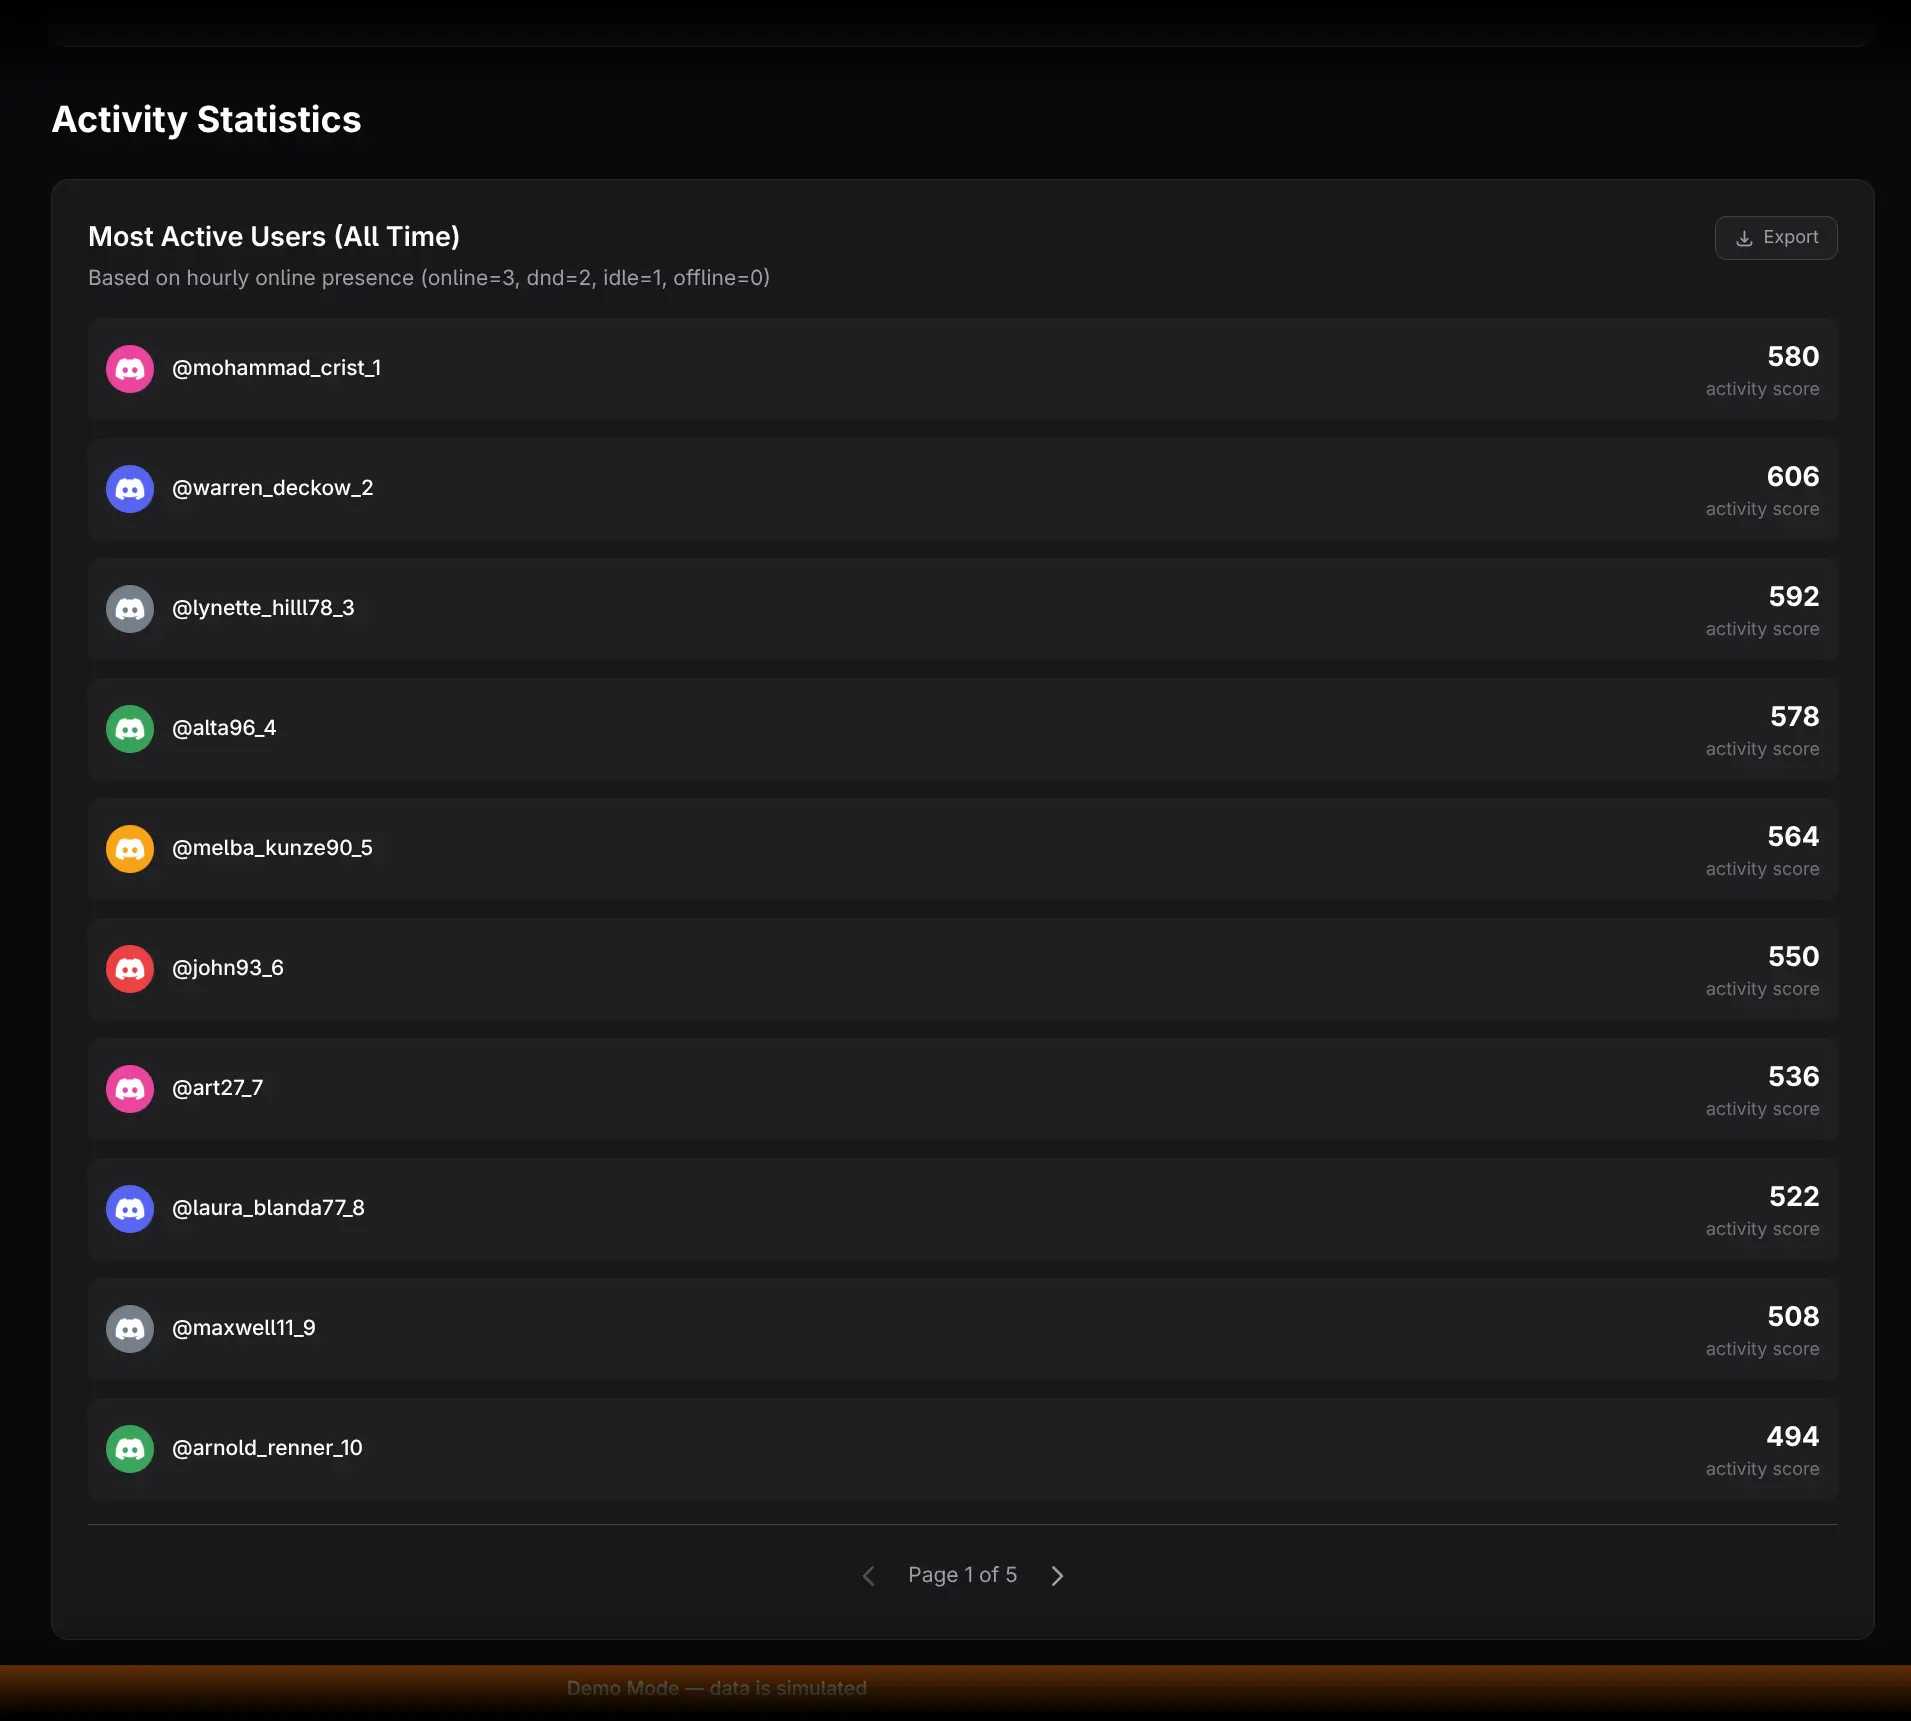
The all-time leaderboard ranks users with a weighted presence score:
Online × 3 + Do Not Disturb × 2 + Idle × 1
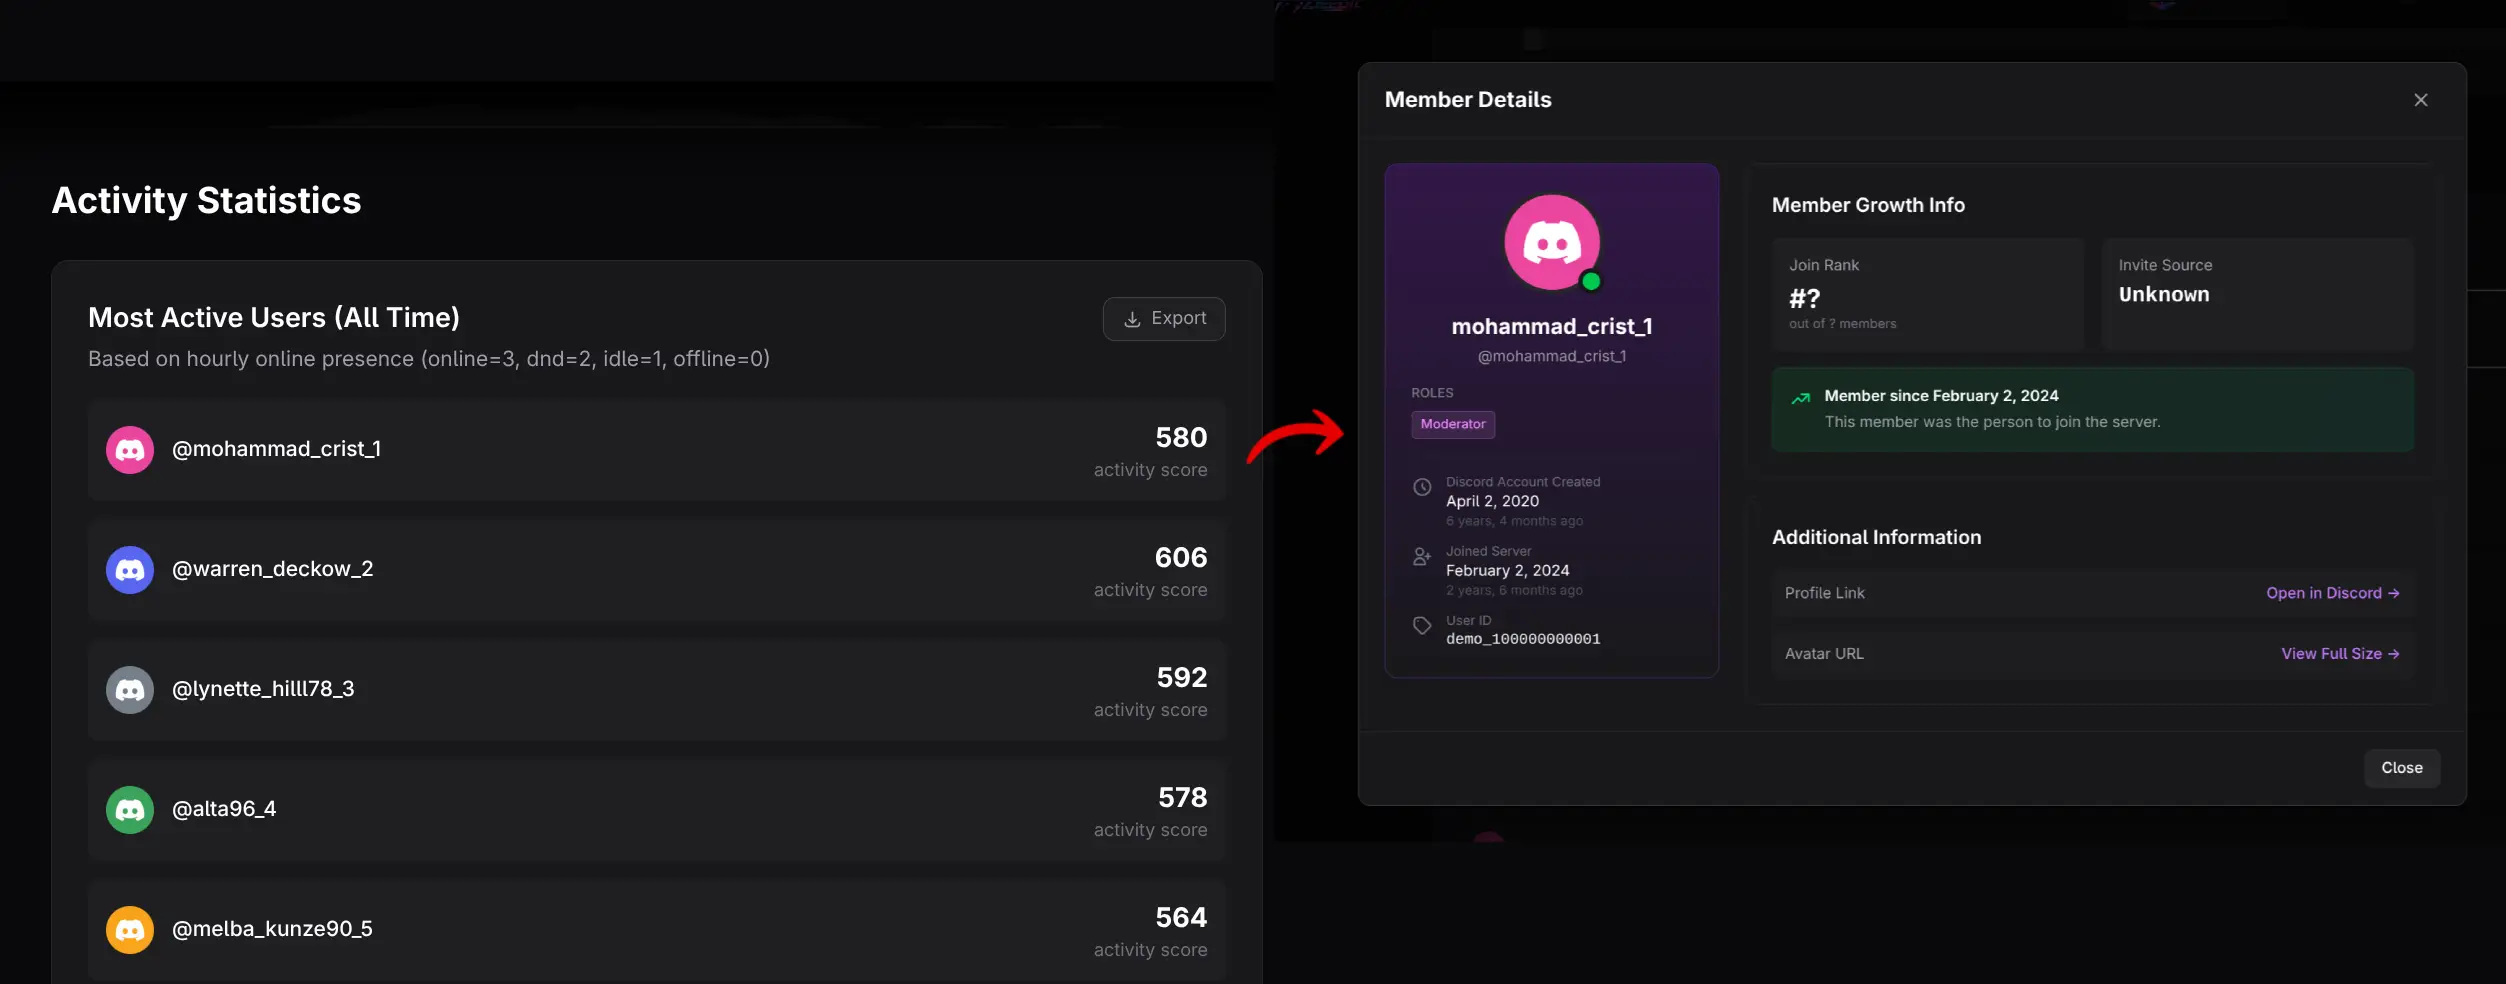
Click a row to open Member Details. Remember that this leaderboard is always all-time even when the chart uses a shorter date range.
Practical workflows
Schedule an announcement or live event
- Select several representative weeks.
- Identify the recurring Most Online hour and day.
- Check whether the online curve is consistently high at that time.
- Compare with the Overview heatmap, Message Activity, and Voice Activity to determine whether members are merely present or actively participating.
Detect availability without engagement
If Online is high while unique chatters, messages, or voice use are low, the issue may be participation rather than reach. Test a prompt, event, or channel change and compare the same hours afterward.
Monitor unusual peaks
Use Peak Concurrent Online to locate a spike, then open other reports for the same timestamp. A peak can come from an event, announcement, raid, or ordinary cyclical behavior; presence data alone cannot identify the cause.
Exporting
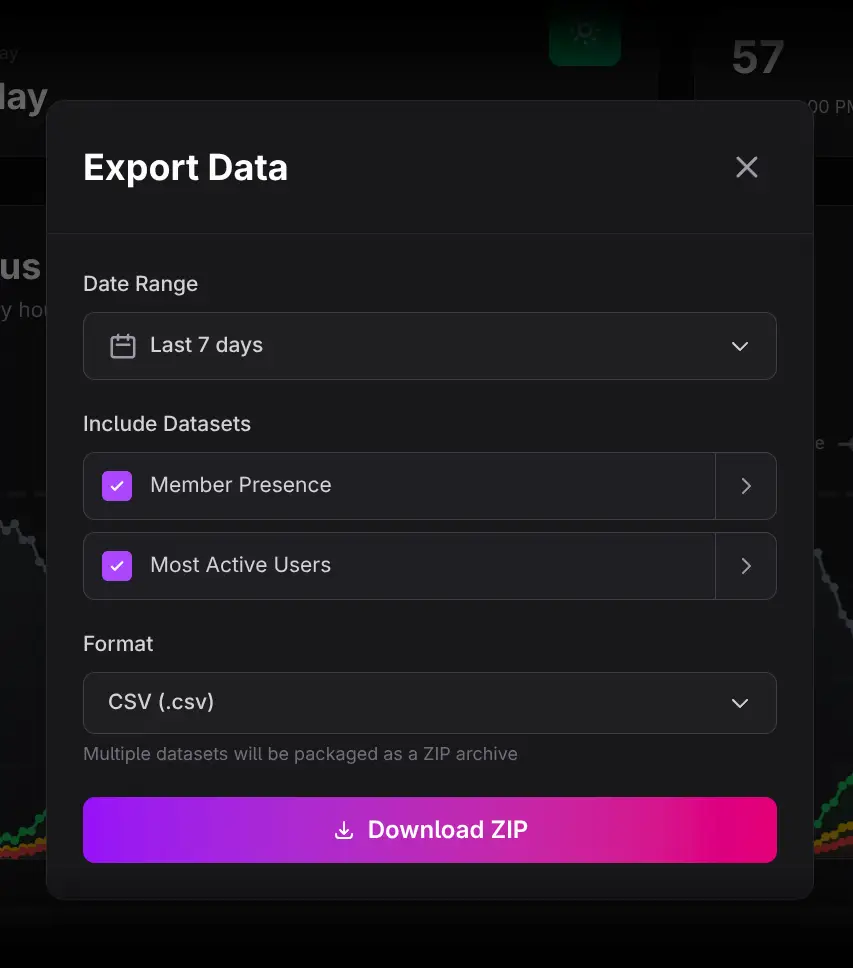
Use Export Data for the page dataset or the chart-level Export button for hourly statuses. Select the desired date range, columns, and CSV, Excel, or Google Sheets format.
Interpretation cautions
- Discord presence is an availability signal, not proof that a member viewed a channel or message.
- The weighted leaderboard prioritizes Online over DND and Idle by design.
- The chart and leaderboard have different time scopes.