Activity Stability
Learn how to measure period-to-period chatter retention and identify who stayed, joined, or stopped chatting.
The Activity Stability report measures whether chat participation continues from one period to the next. It separates returning chatters from people who are new to the current period.
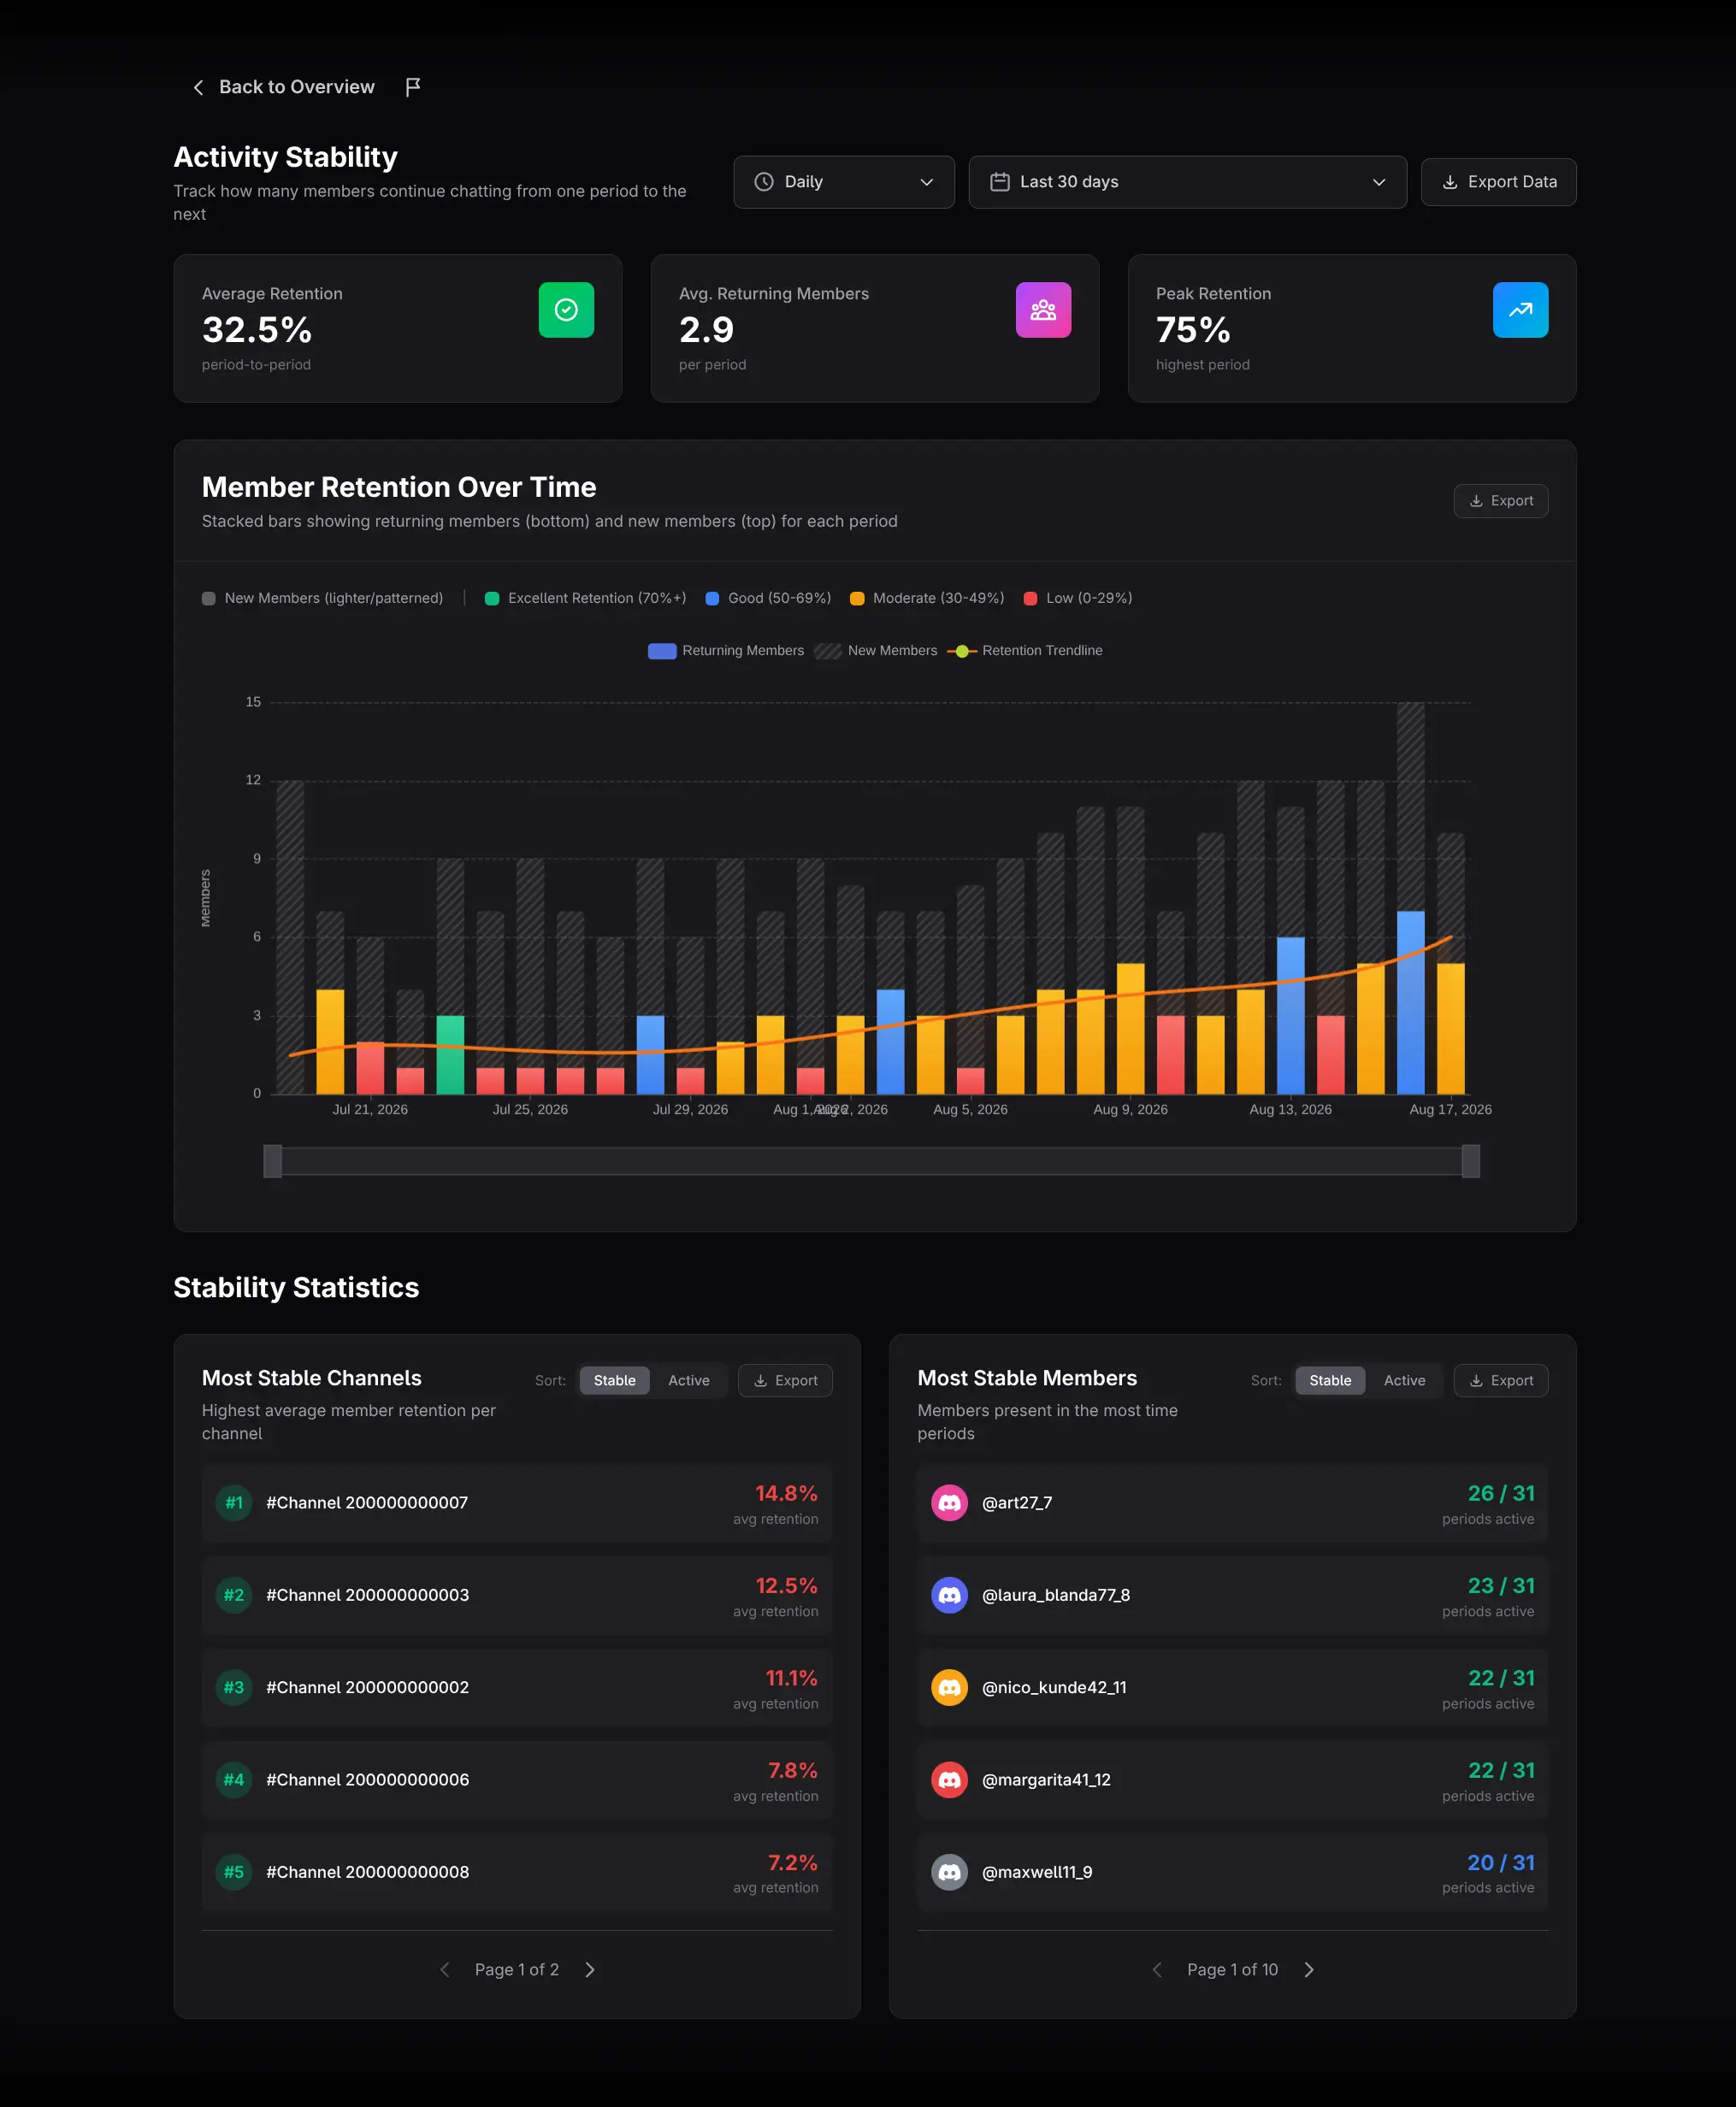
What retention means here
For each period, ZleeBit asks: of the members who chatted in the previous period, what percentage also chatted in the current one? This is behavioral retention, not server membership retention.
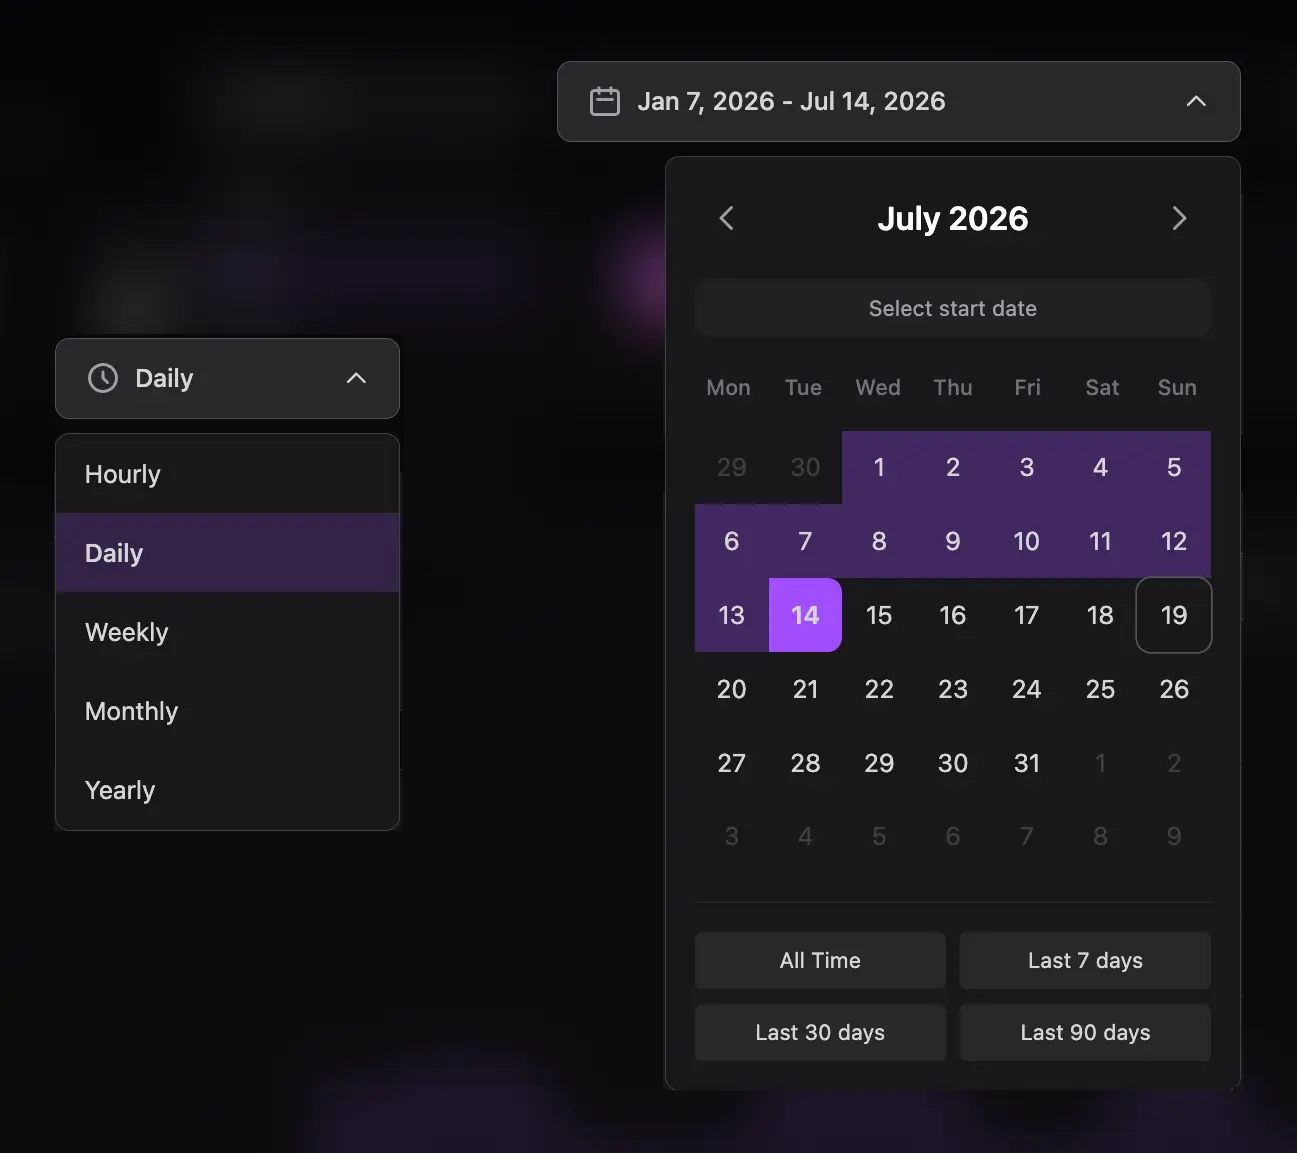
Select a valid comparison
Read the summary cards
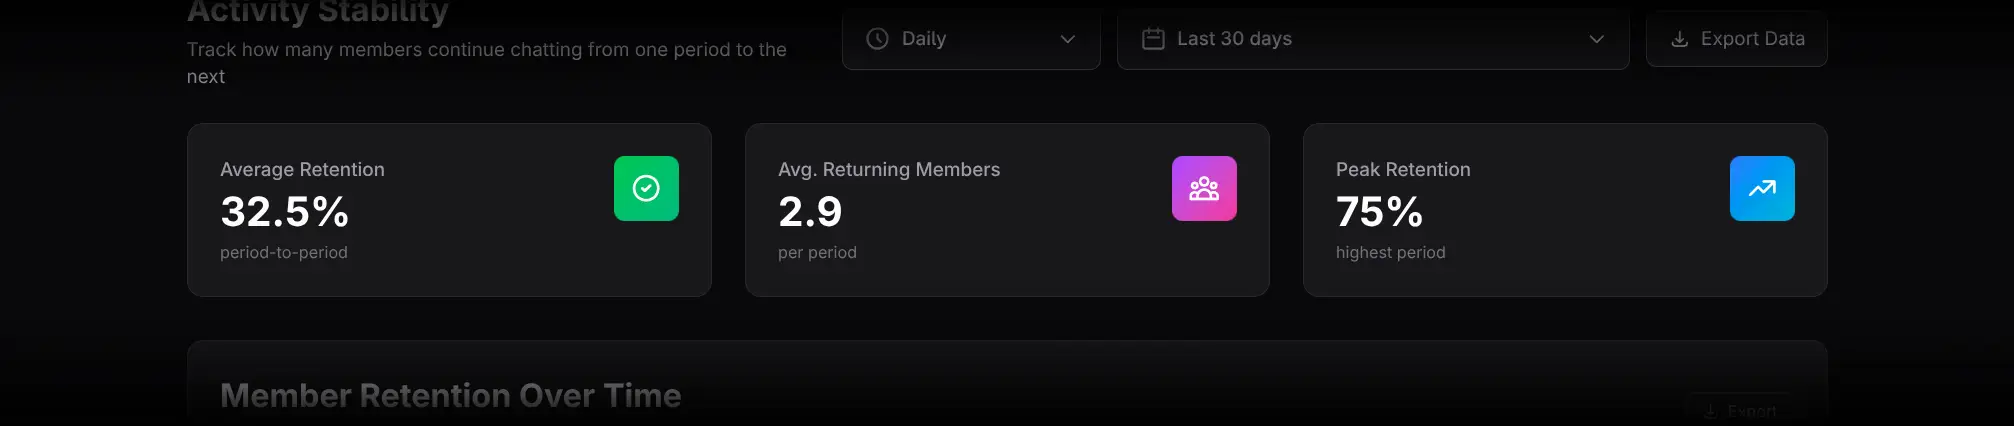
- Average Retention: mean period-to-period chatter retention.
- Avg. Returning Members: average number of returning chatters per period.
- Peak Retention: highest retention percentage reached in one period.
Use the percentage and member count together. A high percentage based on very few people can look healthy while participation remains narrow.
Analyze Member Retention Over Time
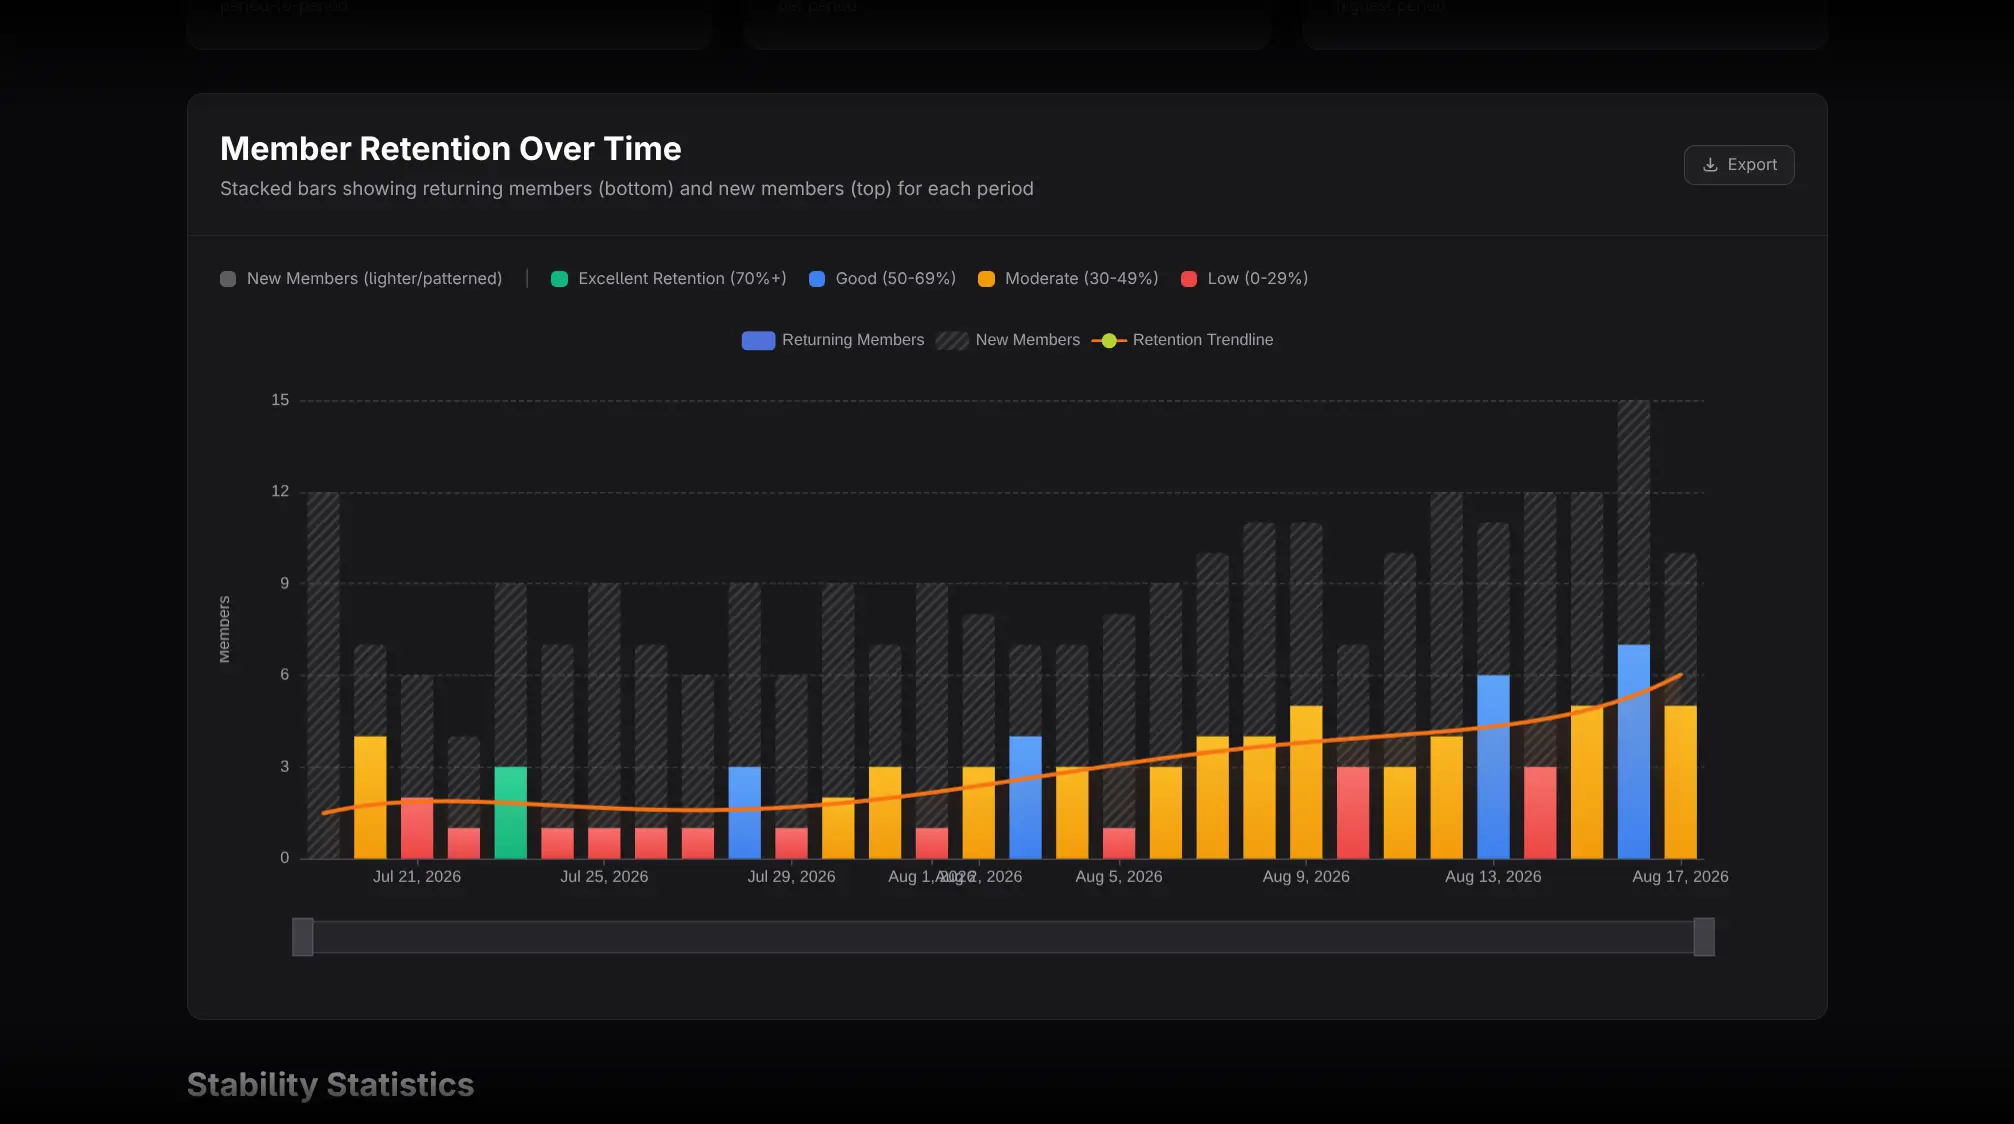
Each stacked bar separates:
- Returning Members: chatted in both the previous and current periods.
- New Members: chatted in the current period but not the previous one.
Period colors classify retention from excellent to low, and the fitted trendline shows direction.
- Hover for the exact period values.
- Click a period bar to open the drill-down.
- Switch between Stayed, Joined, and Left tabs.
- Click a member to open Member Details.
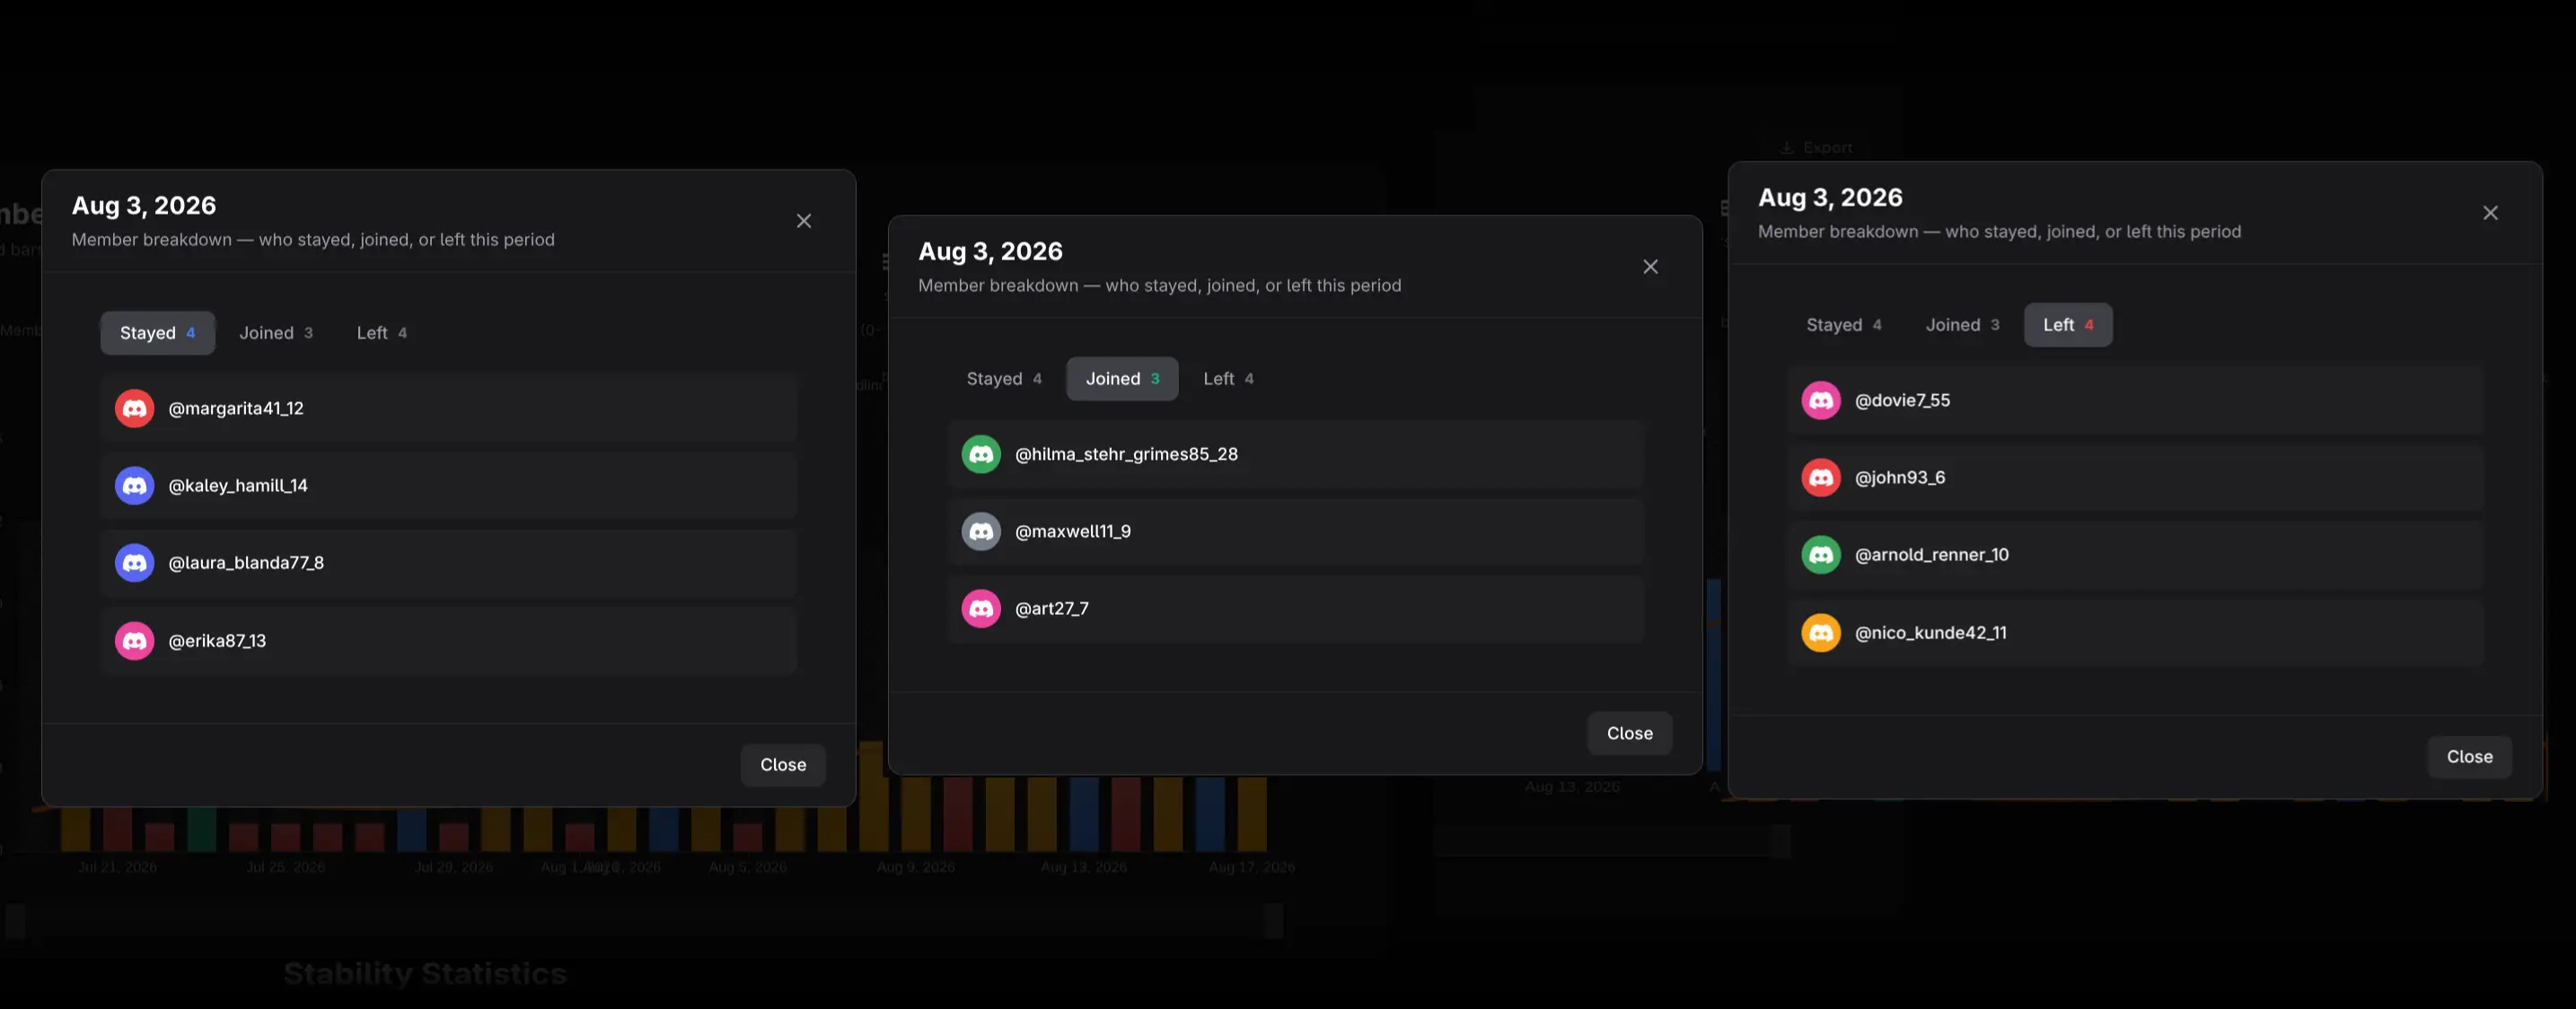
Here, Left means the member stopped chatting between periods; it does not necessarily mean they left the Discord server.
Compare stability and volume
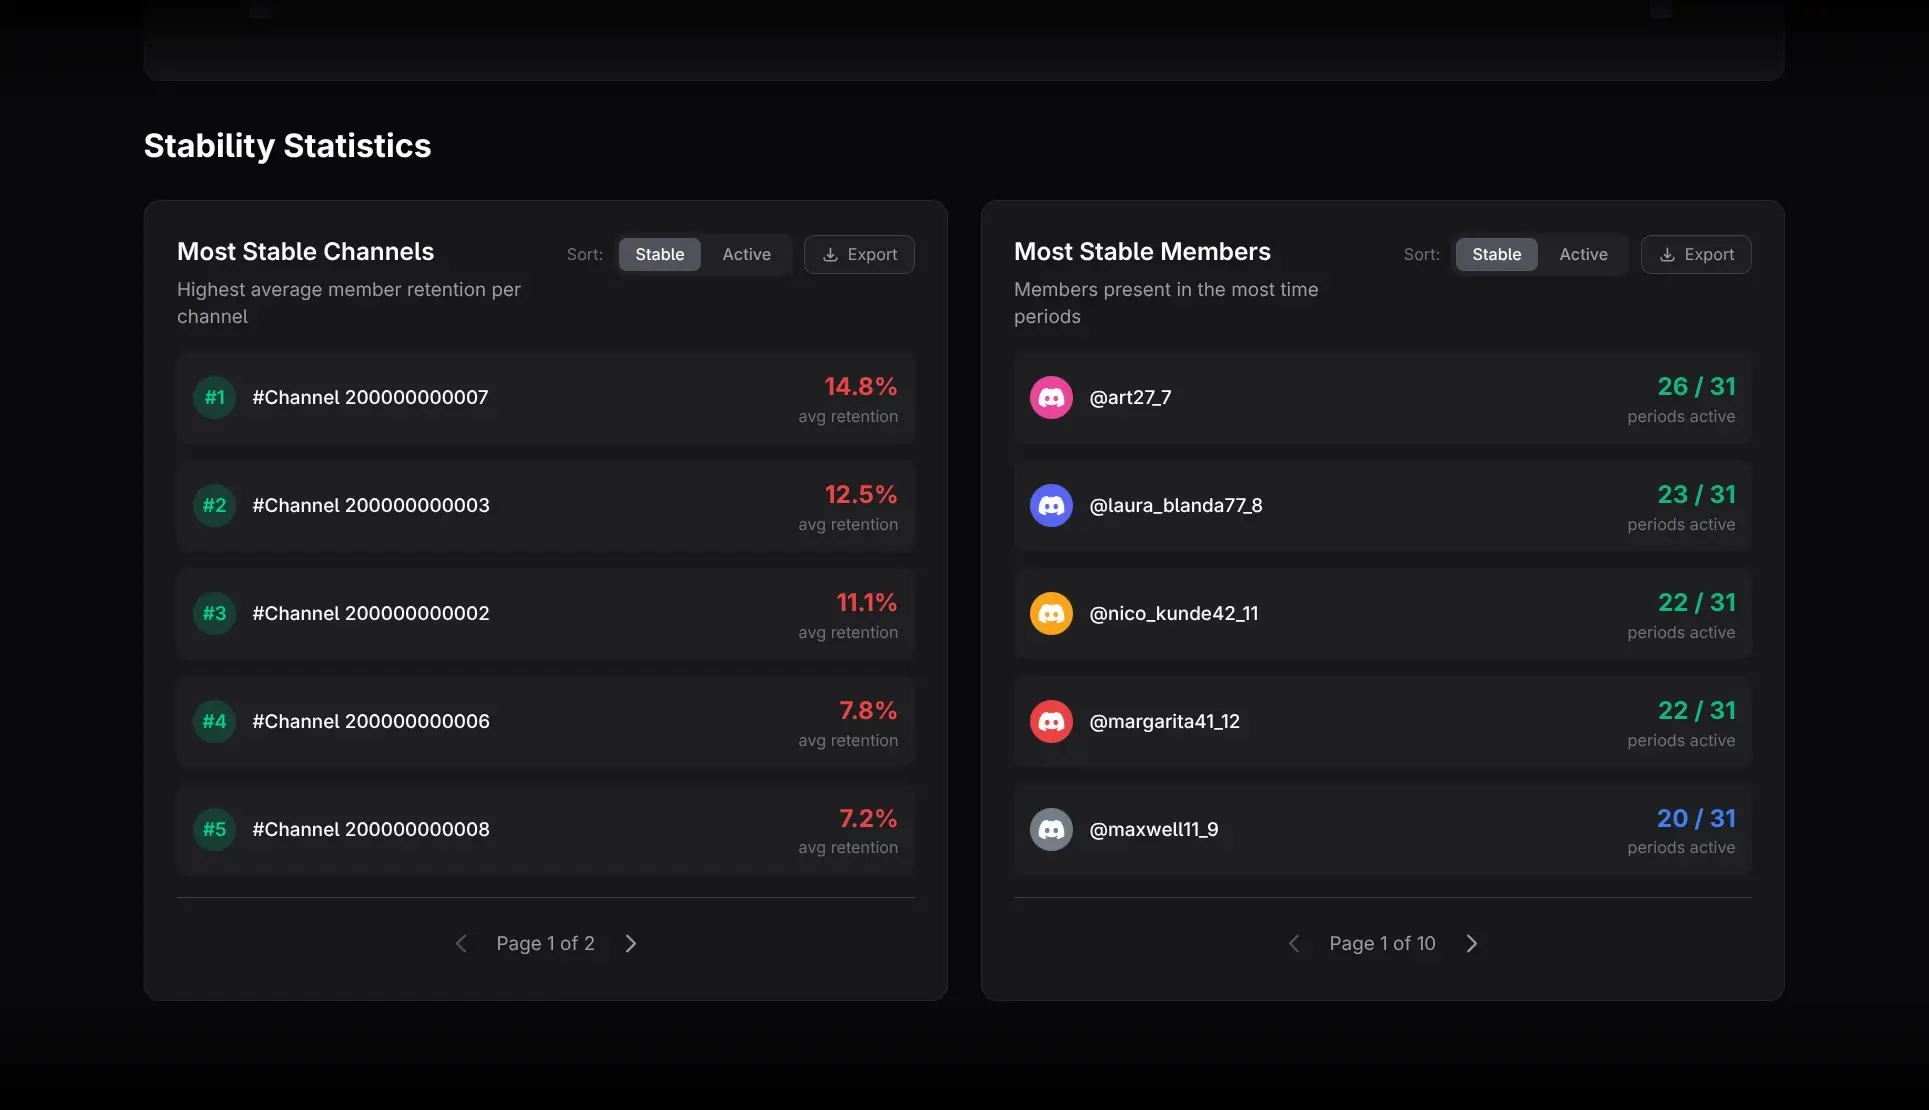
The Channels and Members leaderboards support two modes:
- Most Stable ranks by consistency across periods.
- Most Active ranks by raw message volume.
The distinction matters. A consistently active medium-sized channel may be more reliable than a high-volume channel driven by one event.
Practical workflows
Measure recurring community behavior
Use Weekly periods over several months. Monitor Average Retention and the trendline, then inspect low-retention periods to identify which members stopped participating.
Evaluate an event strategy
If an event creates many New Members but the next period shows a large Left group, the event generated activation without continued behavior. Test follow-up programming and compare the next cohort.
Find dependable channels
Compare Most Stable Channels with Most Active Channels. Use stable channels as anchors for announcements or recurring programming, while checking whether their audience is sufficiently large.
Exporting and cautions
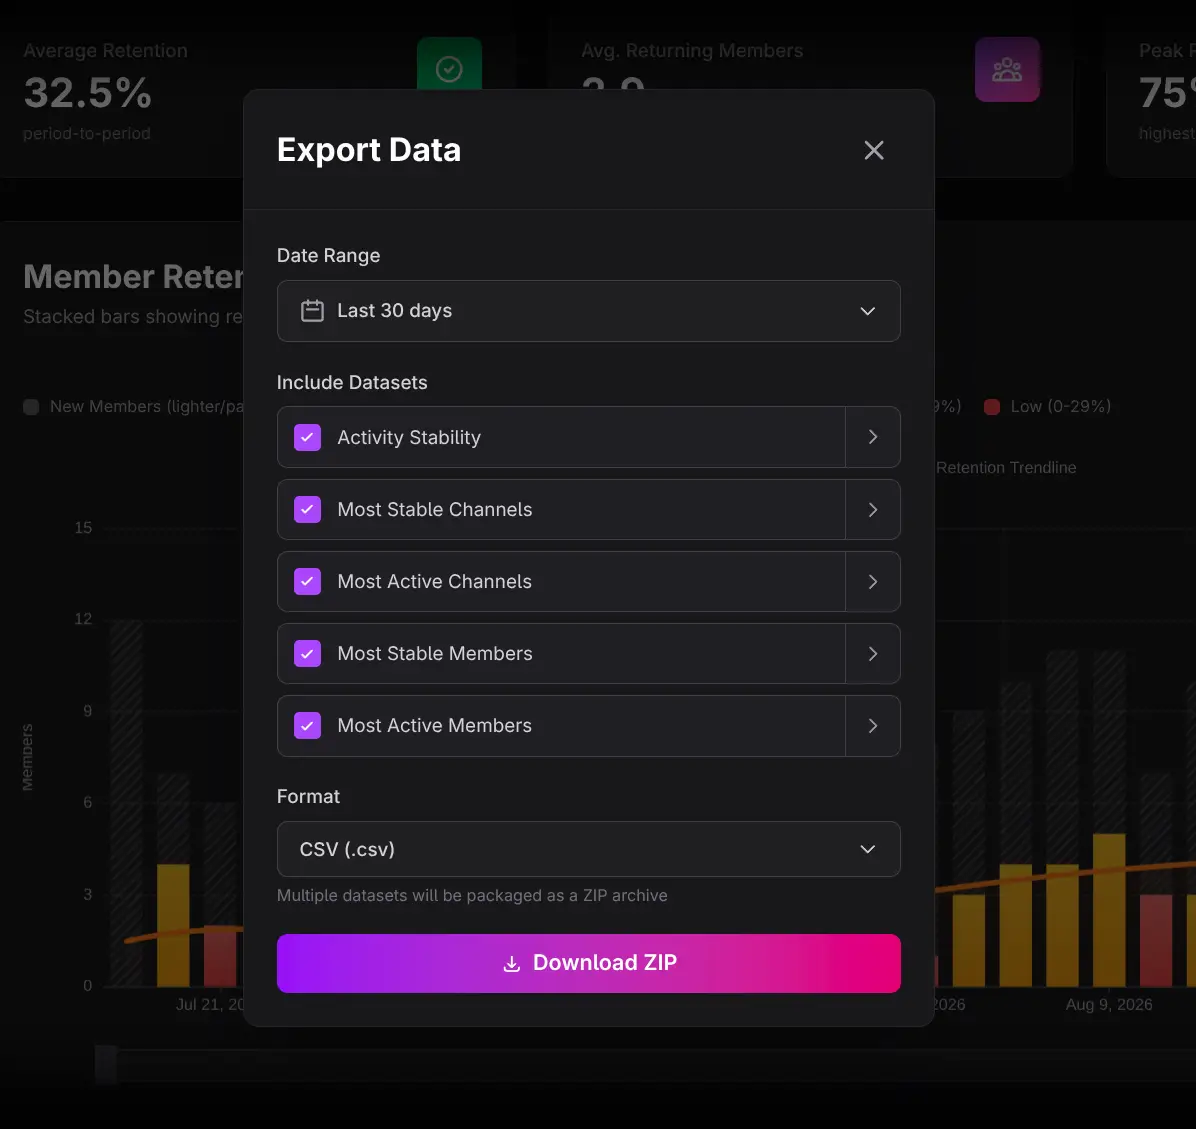
Use Export Data for multiple retention datasets or the chart-level Export control for period data.
- Results depend strongly on granularity; daily and monthly retention are not directly comparable.
- Behavioral Left is not the same as leaving the server.
- At least two periods are required.
- Retention does not explain why behavior continued or stopped.