Overview
Learn how to read the main server metrics, charts, insights, and drill-downs on the ZleeBit Overview page.
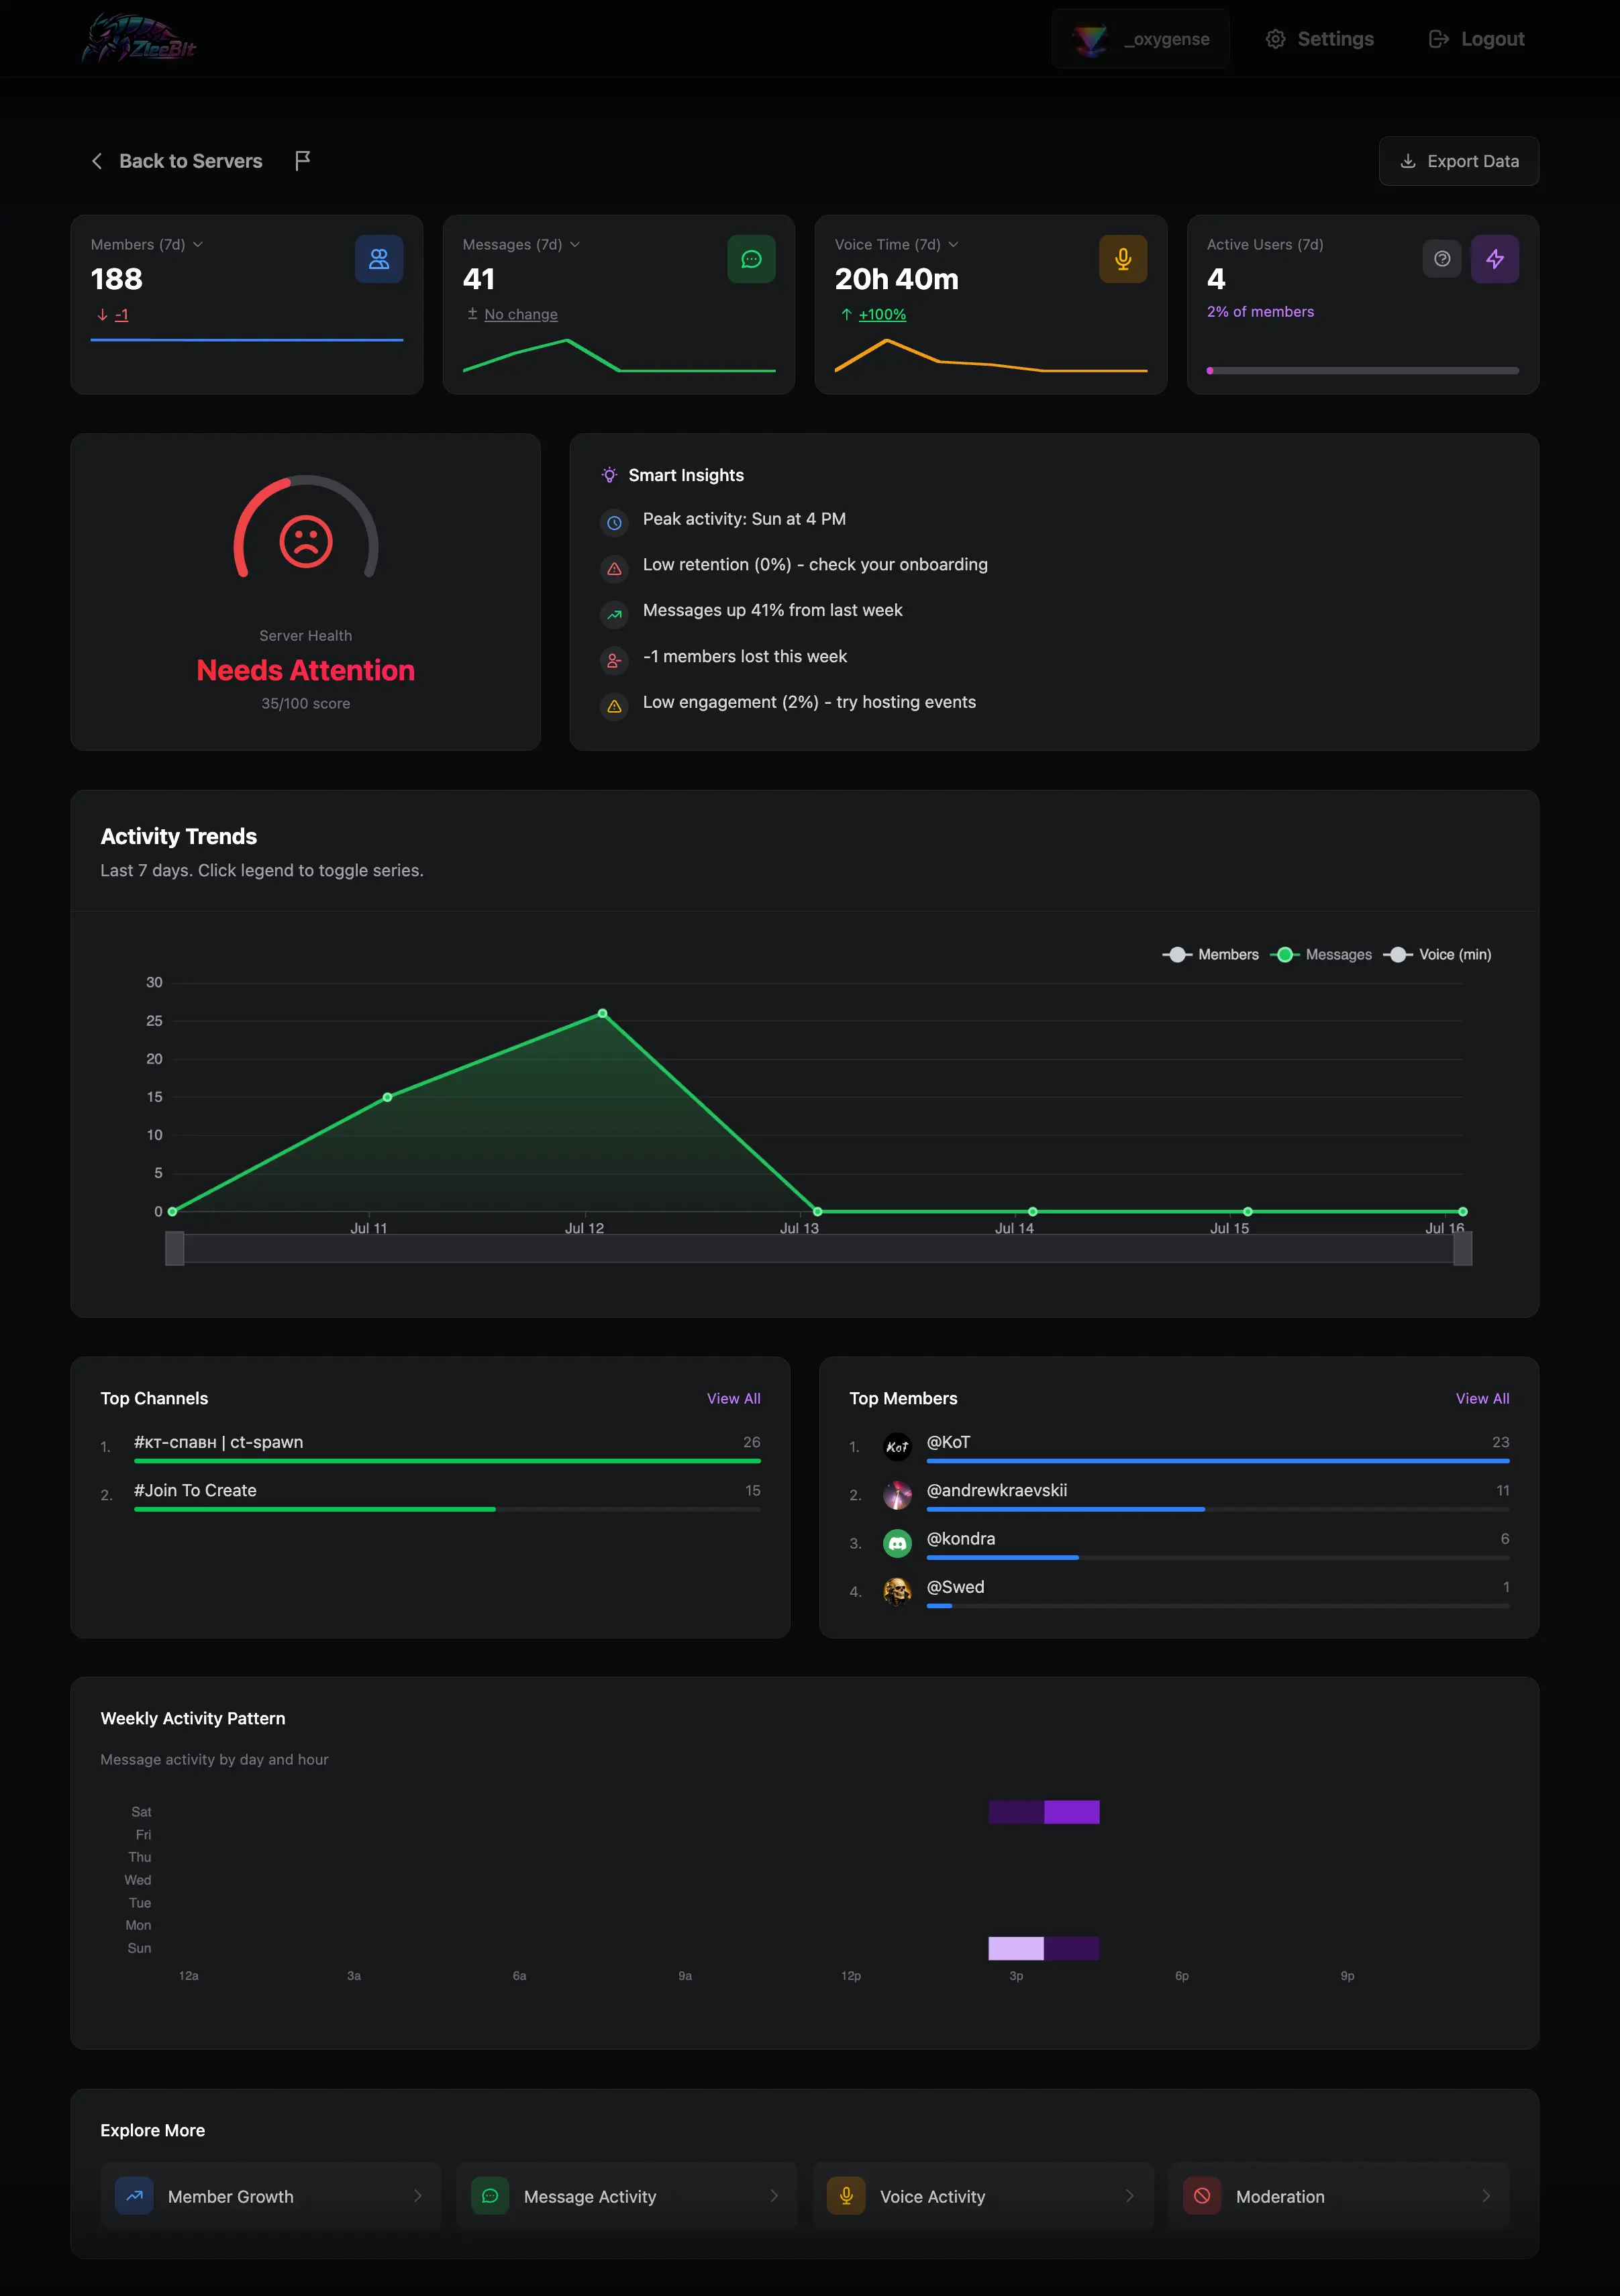
The Overview is the starting point for understanding a Discord server in ZleeBit. It combines the server's most important member, message, voice, and engagement signals in one place. Use it for a quick health check before opening a specialized report.
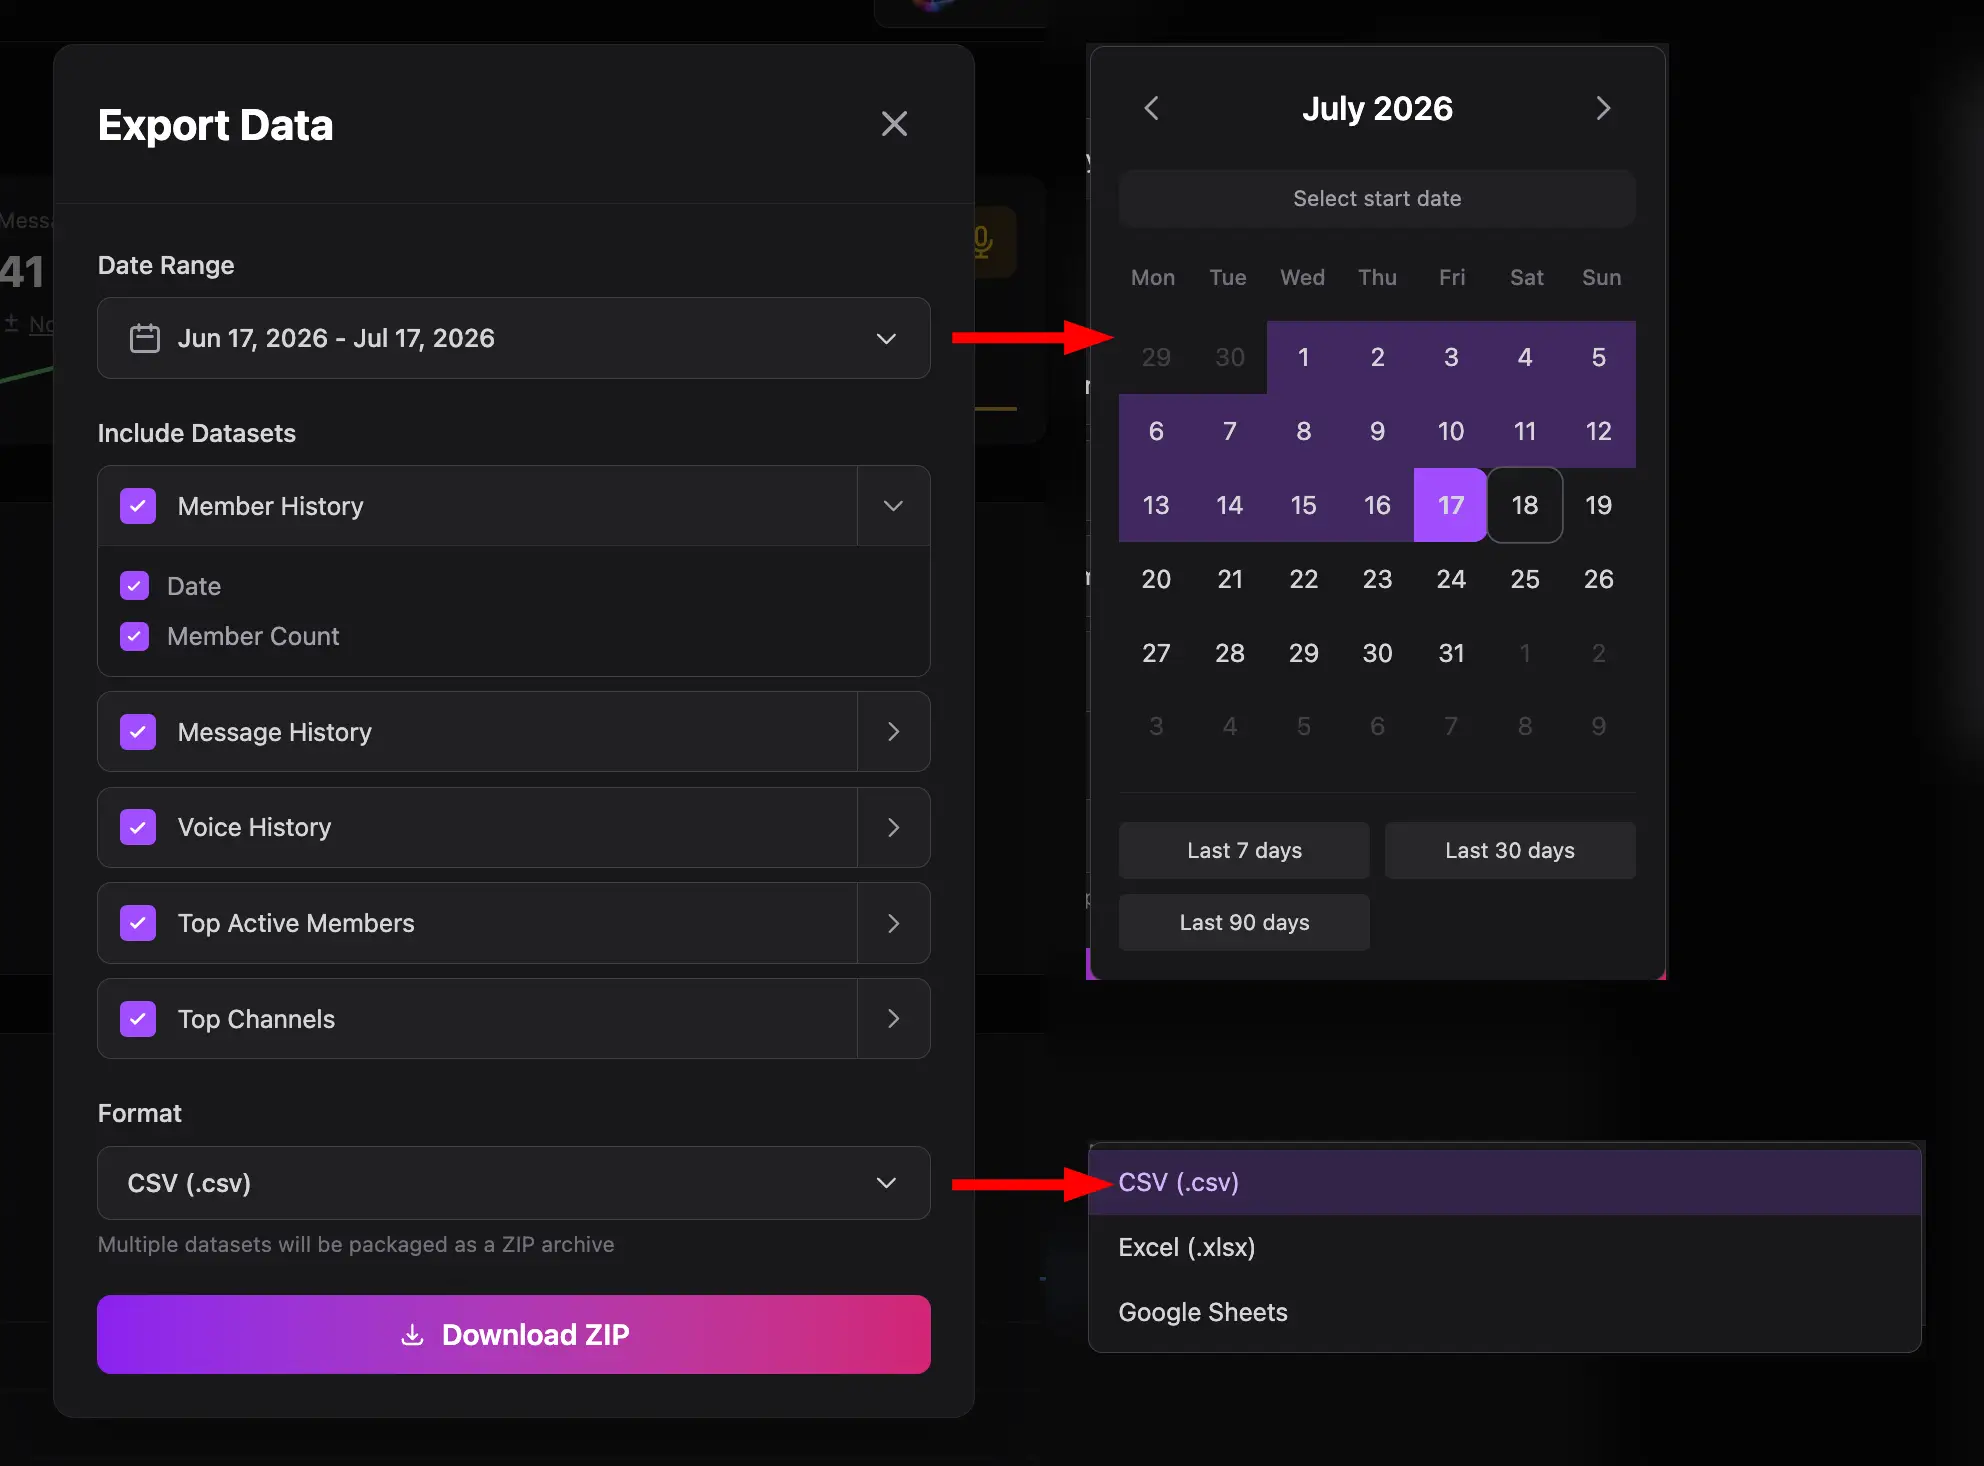
Report scope: Most values on this page use a fixed rolling seven-day window. The page itself has no date-range control. You can select another range only when exporting data.
What you can learn
- Whether the server is growing or losing members.
- How much message and voice activity occurred during the last seven days.
- What percentage of members were active.
- Whether server health needs attention.
- Which channels, members, days, and hours generated the most activity.
Start with the four summary cards
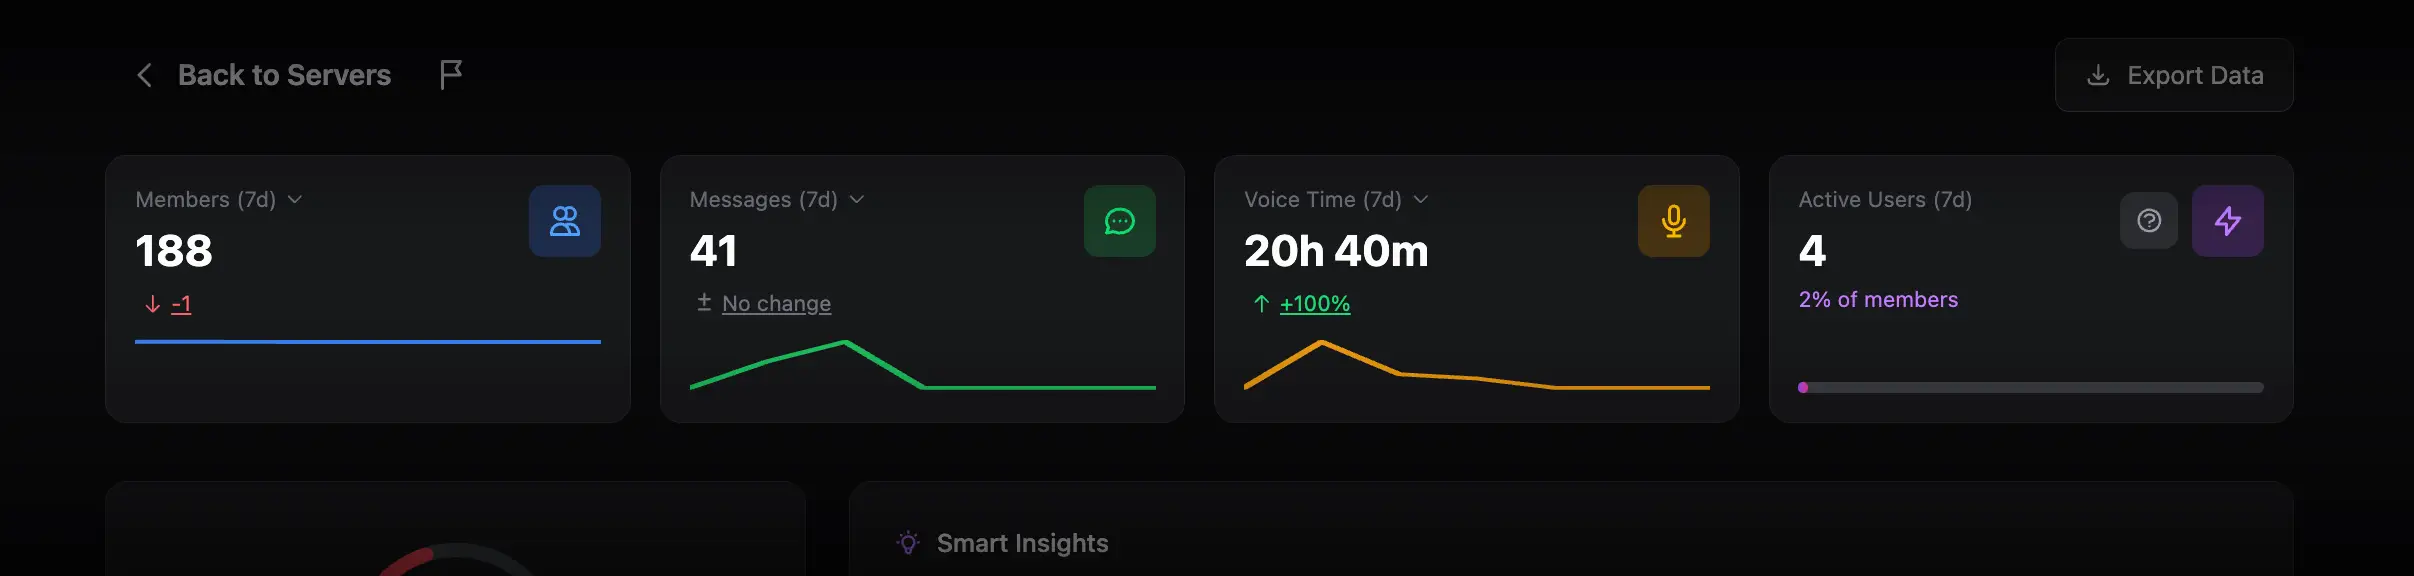
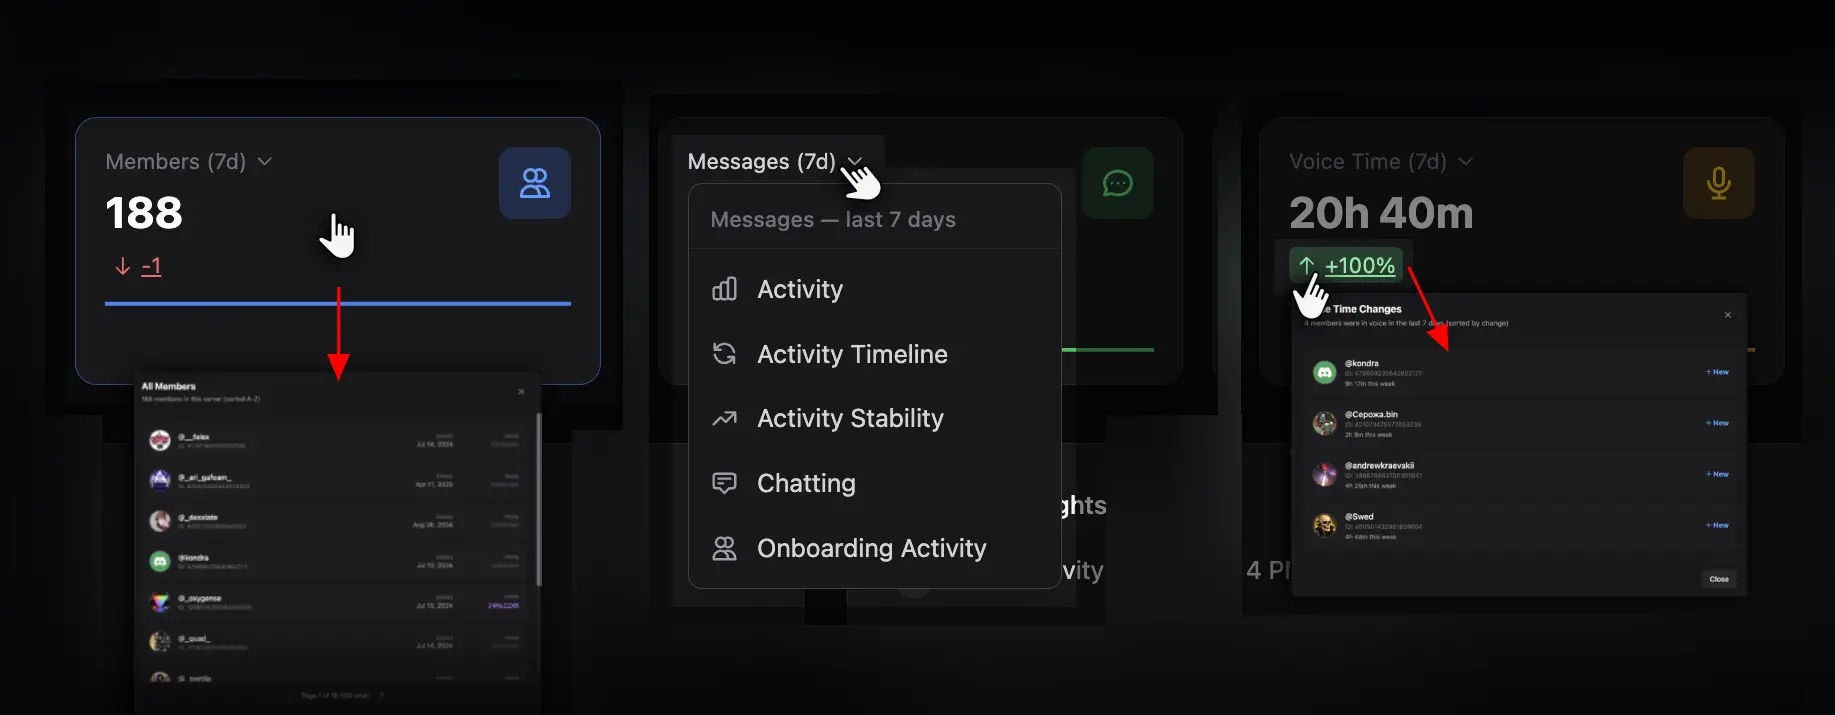
- Members (7d) shows the current member total. Click the main card to see all members. Click the change value to review joins and leaves from the last seven days. Use the label menu to open Growth, Invites, Presence, or Insights.
- Messages (7d) shows messages sent during the period. Click the card to see all chatters ranked by message count. Click the change indicator to compare individual users with the previous seven days.
- Voice Time (7d) shows total voice time. Click the card for a user ranking, or the change value for a previous-period comparison.
- Active Users (7d) counts members who sent at least one message. The percentage below it shows the share of all members. Click the information icon to read the scoring explanation, or the card to open a blended ranking based on messages and voice time.
Read Server Health and Smart Insights
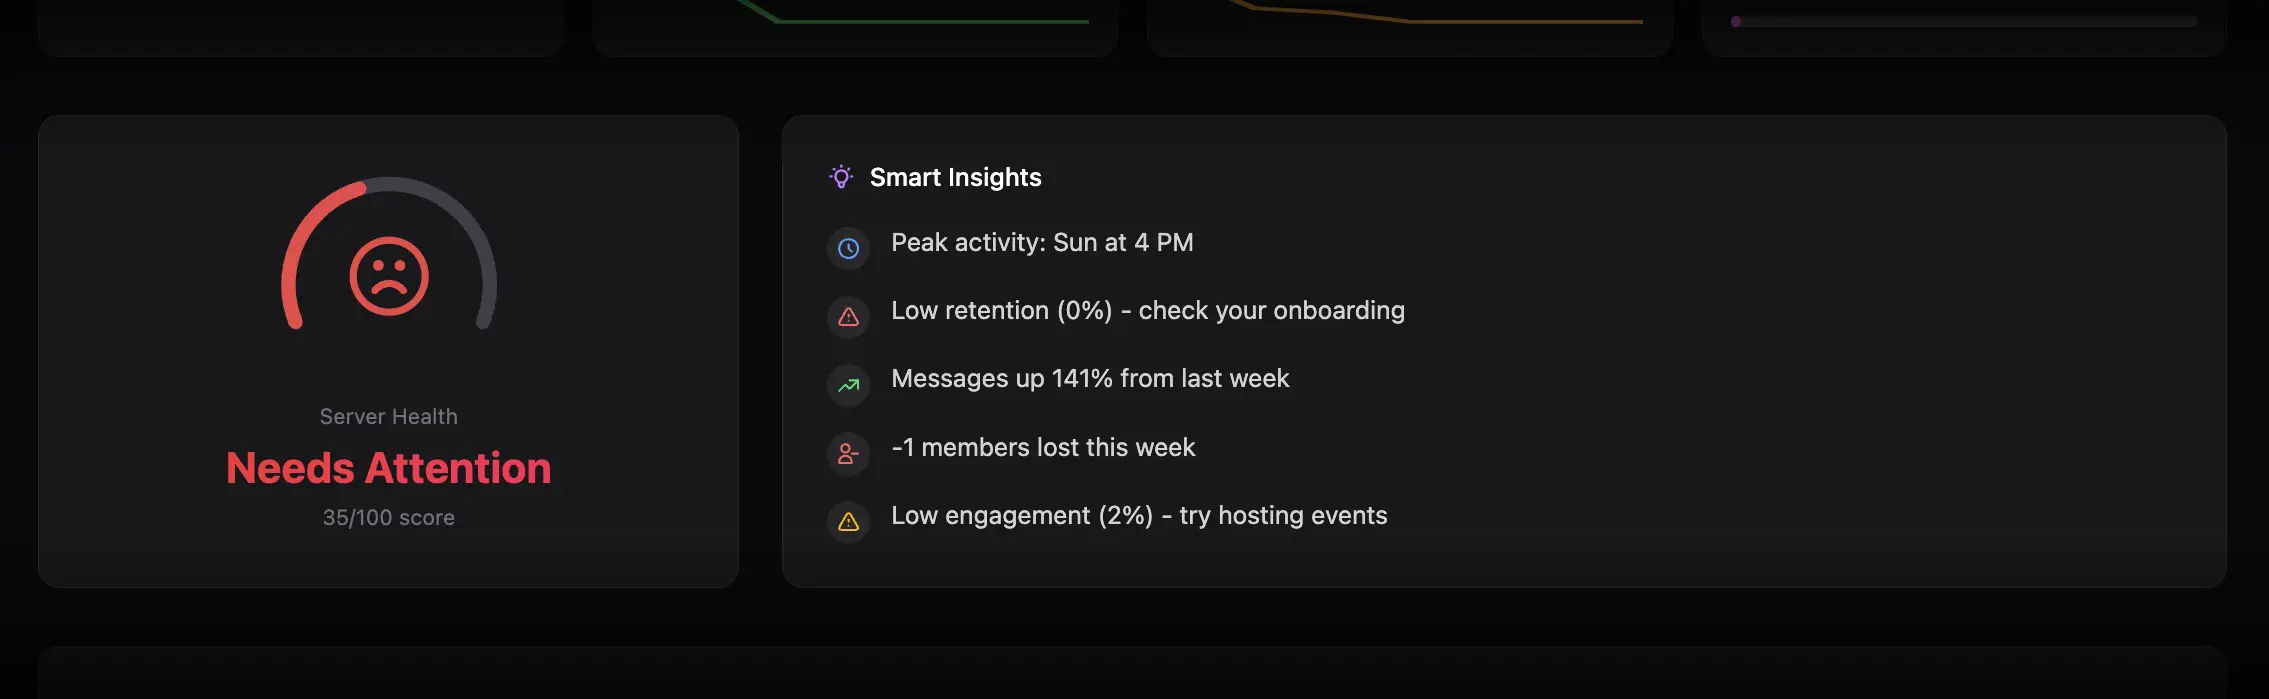
Server Health is a 0–100 summary based on growth, message activity and trend, and retention. Treat it as a diagnostic signal, not a final judgment. If the score is low, use Smart Insights to identify which component is weakening it.
Smart Insights lists up to five automatic observations, such as the peak activity time, message trend, retention level, net member change, and engagement rate. Use each observation as a starting point for a deeper report.
Explore the charts
Activity Trends
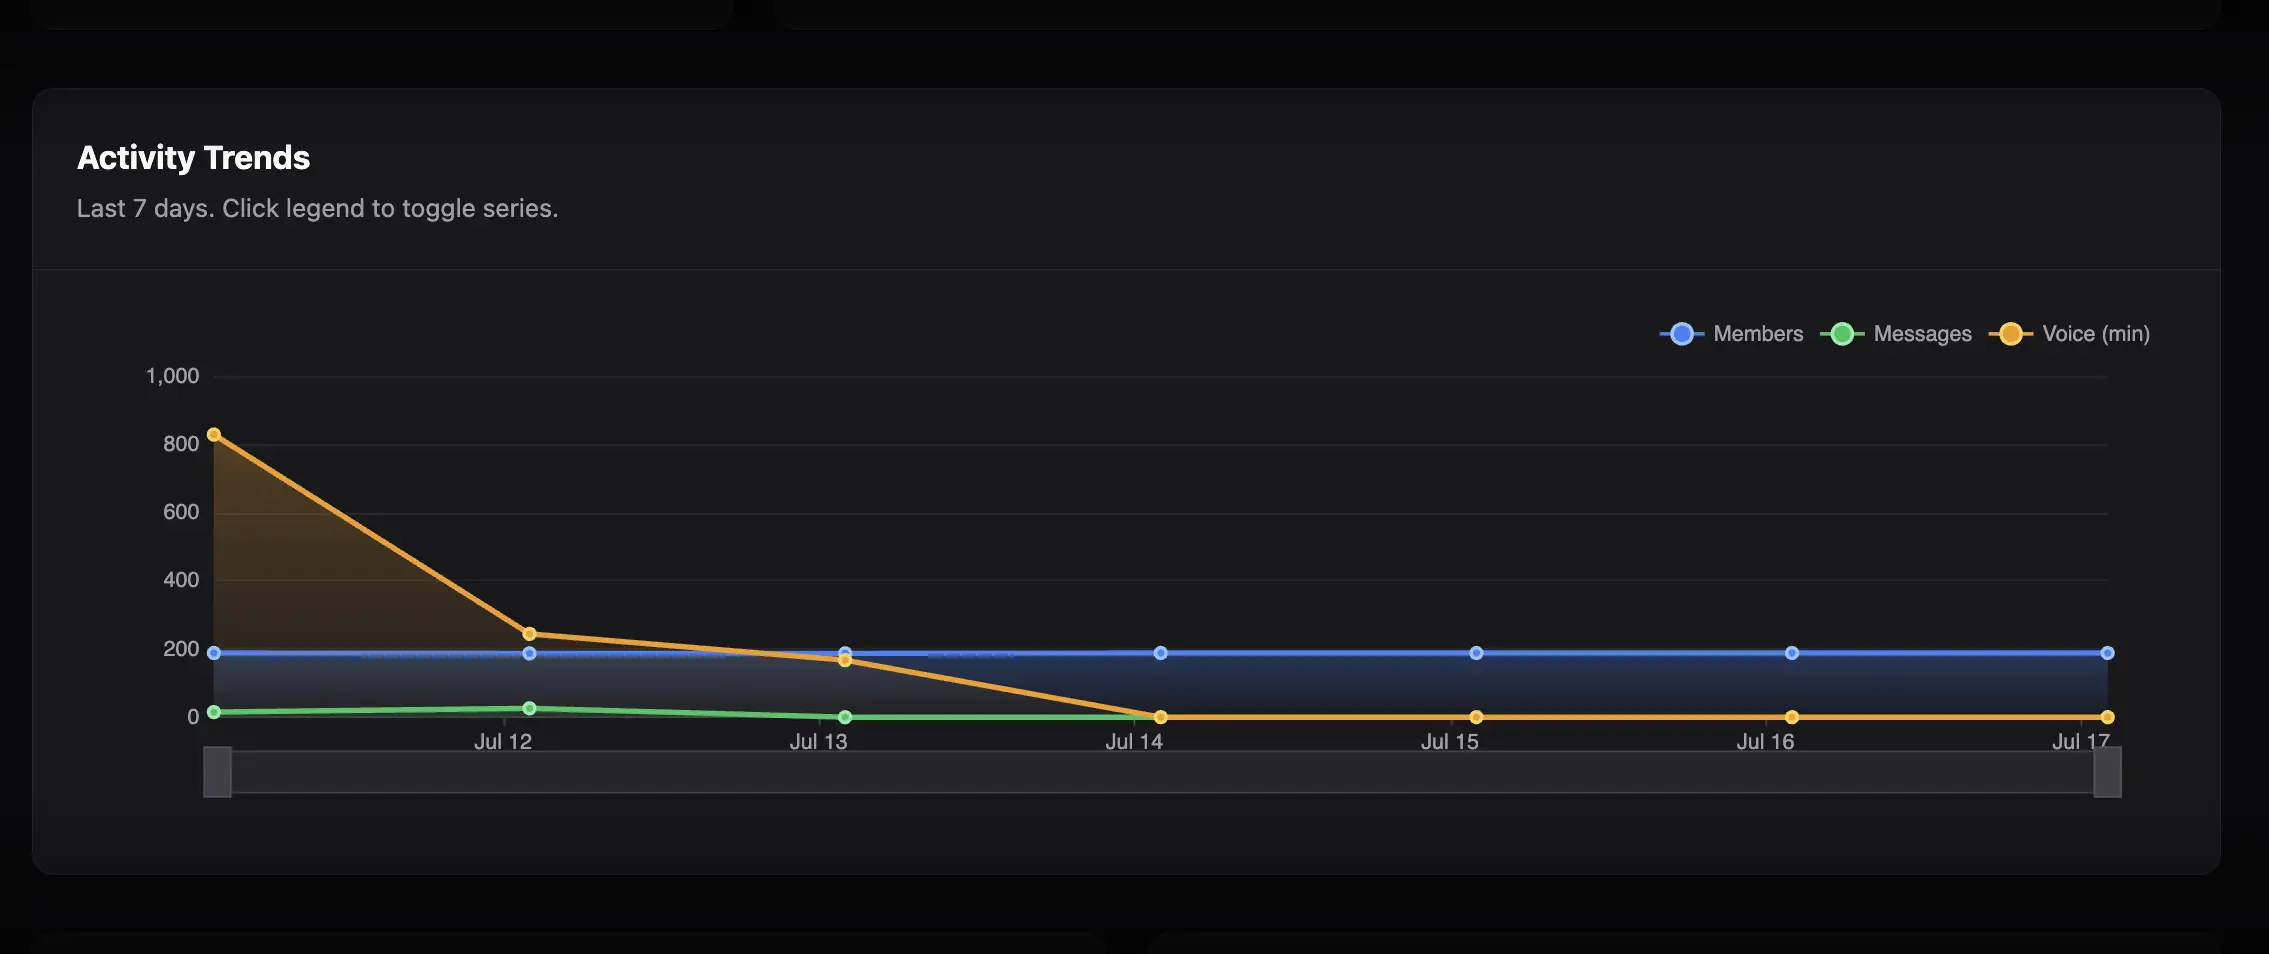
The chart compares Members, Messages, and Voice Minutes. Click legend items to show or hide a series, hover for exact values, and zoom or pan to inspect a shorter segment. The chart does not open member-level details.
Weekly Activity Pattern
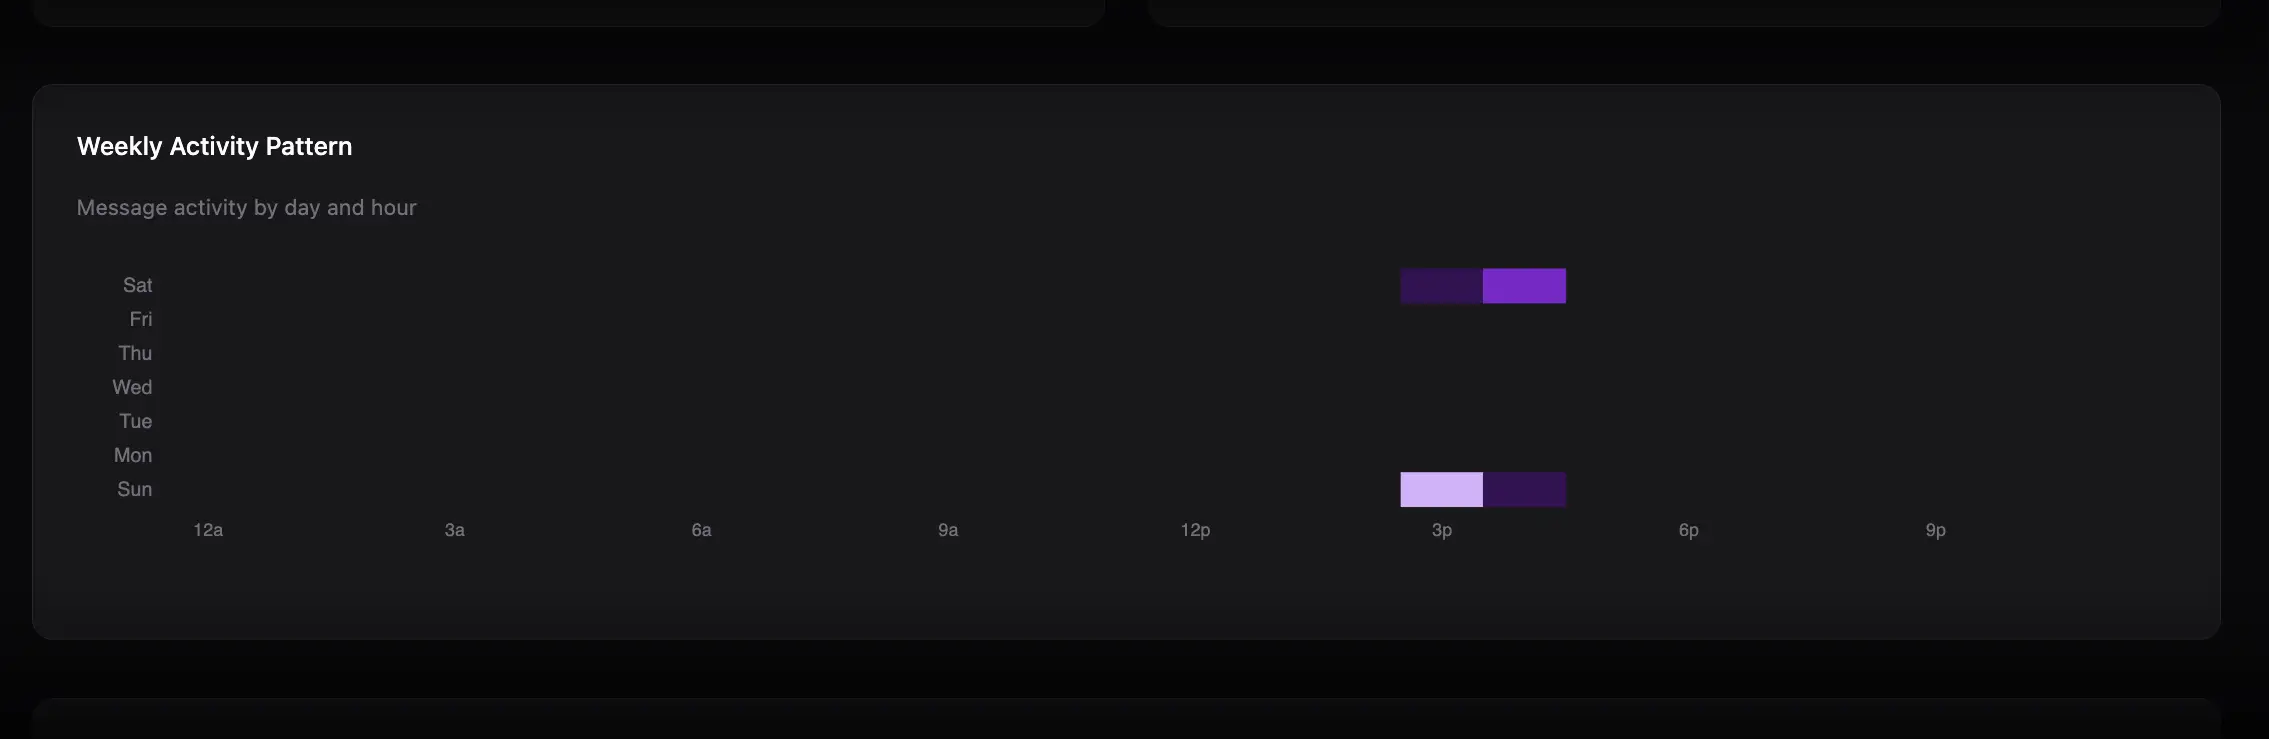
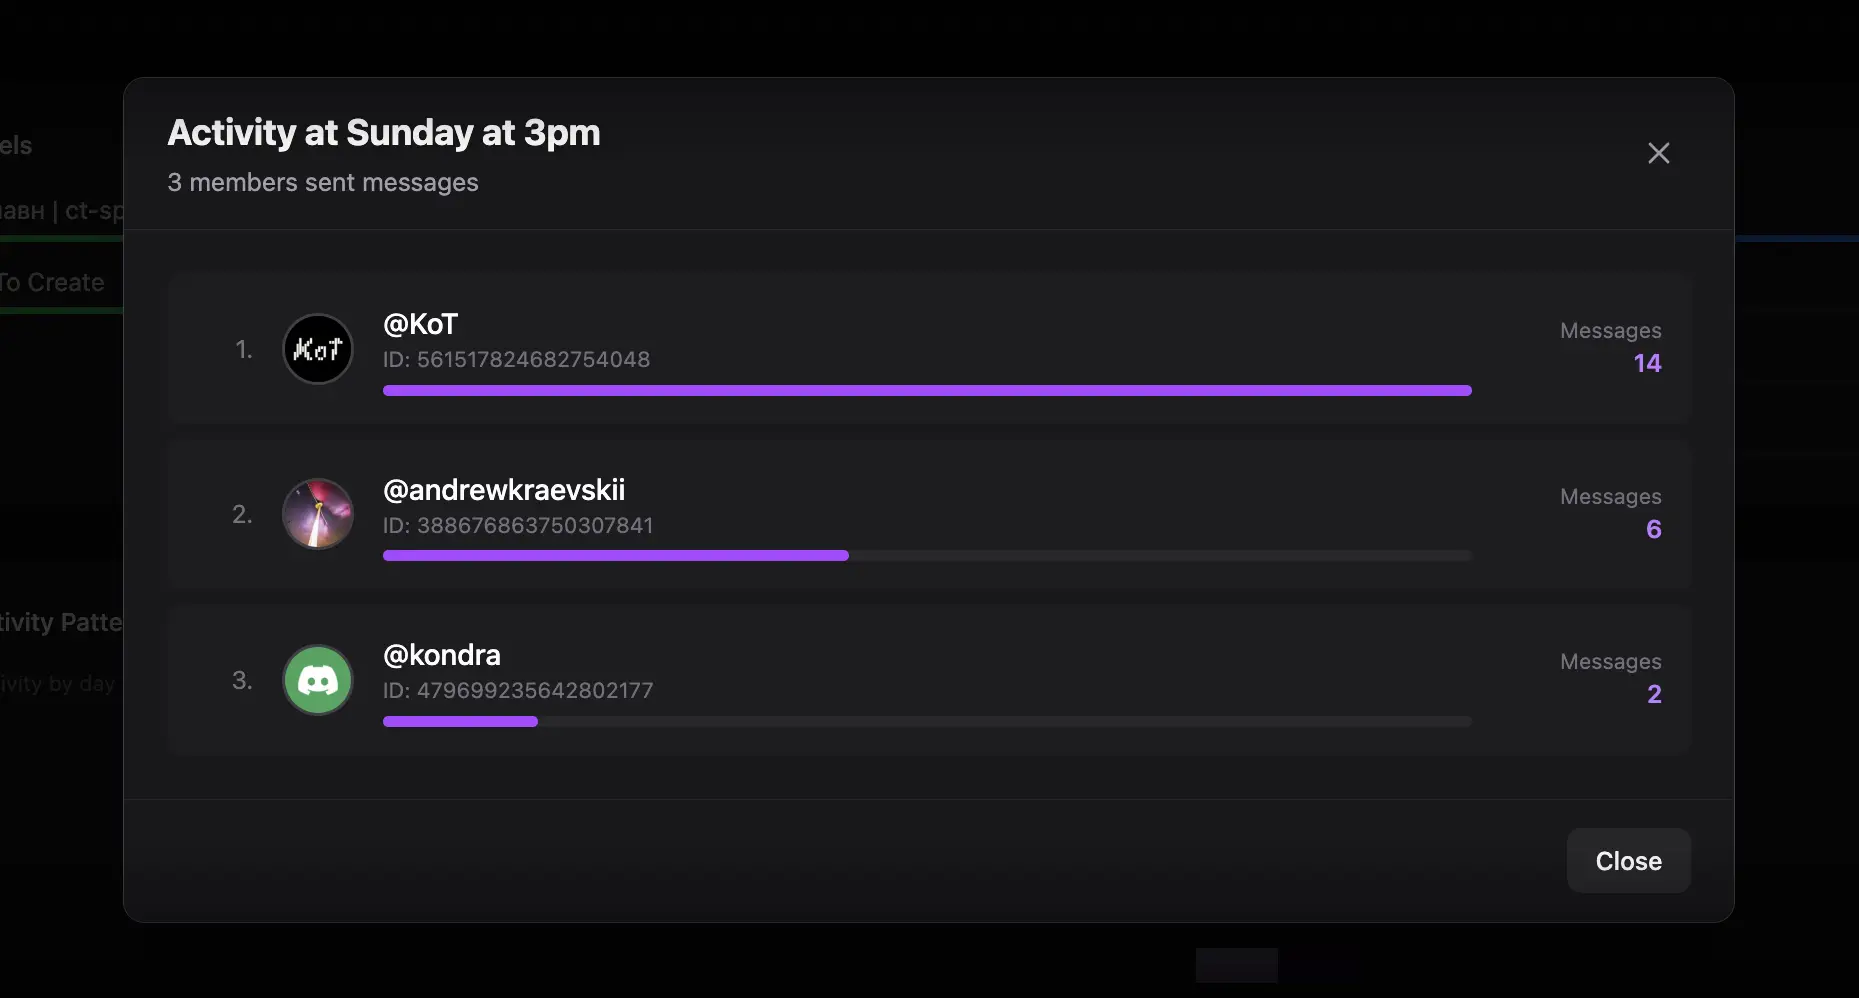
This heatmap maps message volume by day of week and hour of day. Darker or stronger cells indicate more activity. Click a non-empty cell to open the members who chatted in that exact time slot. Click a member in the modal to open Member Details. Empty cells do not open anything.
Use the leaderboards
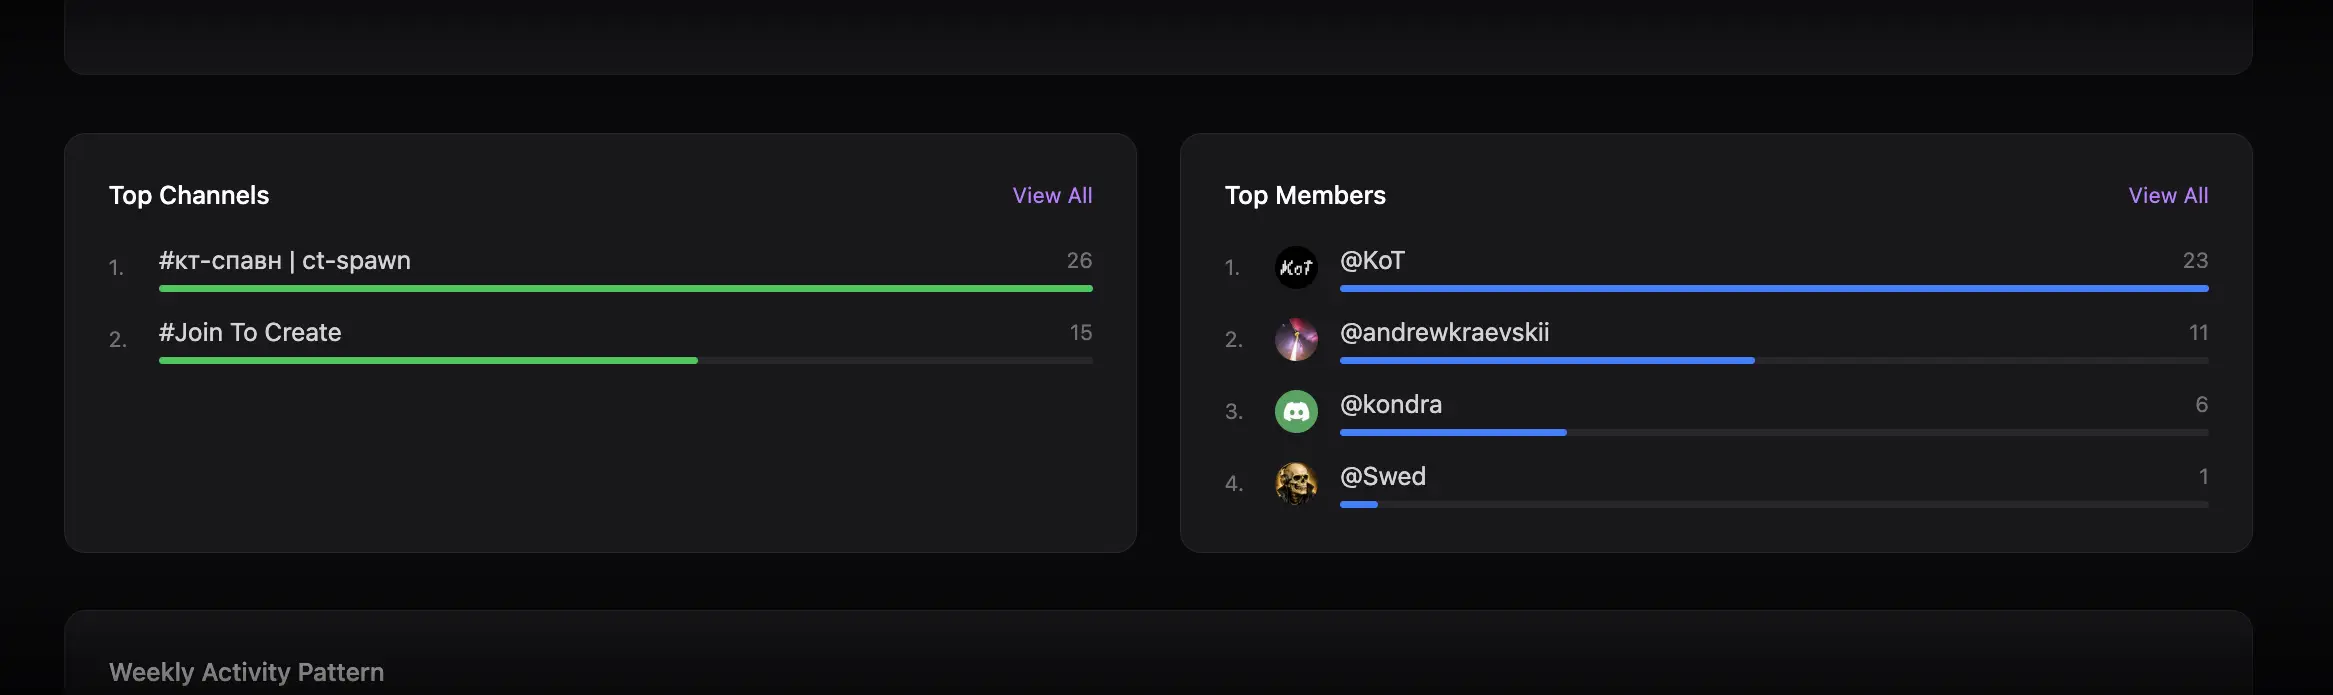
- Top Channels shows five channels; View All expands the ranking to as many as 50.
- Top Members shows five members; View All expands the ranking to as many as 100.
These two rankings are for orientation only: their rows do not open channel or member details.
A practical review workflow
- Check the four summary cards for direction and scale.
- Read the health score and Smart Insights.
- Use Activity Trends to determine which activity type changed.
- Use the heatmap to find the best event, announcement, or moderation windows.
- Open the relevant specialized report from the card menus or Explore More shortcuts.
- Use Export Data to download Member History, Message History, Voice History, Top Active Members, or Top Channels as CSV, Excel, or Google Sheets.
Important interpretation notes
- Demo Mode uses simulated data.
- A seven-day improvement can be temporary; compare it with a longer range in a specialized report.
- High message volume does not necessarily mean broad participation. Compare Messages with Active Users and the Chatting report.
- Modal member lists support drill-down. The back arrow returns you to the list you opened.