Activity
Learn how to analyze message volume, trends, contributors, channels, and privacy-preserving replay data.
The Message Activity report is the main volume view for server chat. It shows how many messages were sent, how that volume changes over time, which users contribute most, and which channels receive the most messages.
Set the period and granularity
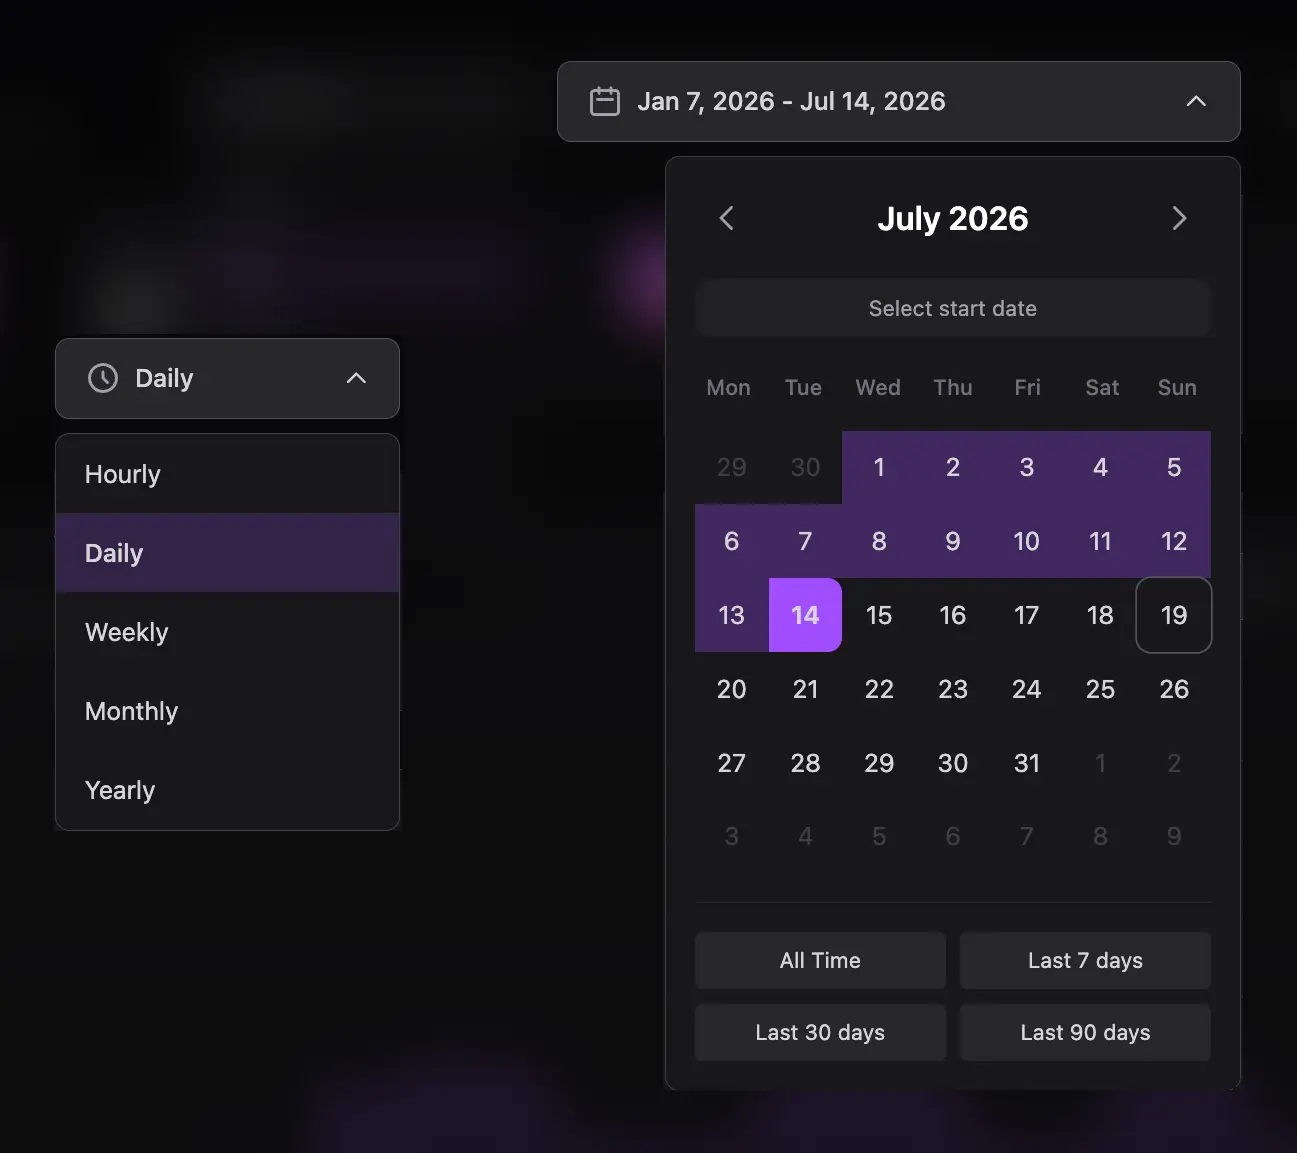
Choose Hourly, Daily, Weekly, Monthly, or Yearly grouping and select the date range. Use Hourly for a short event window, Daily or Weekly for operational monitoring, and Monthly or Yearly for long-term direction.
Read the summary cards
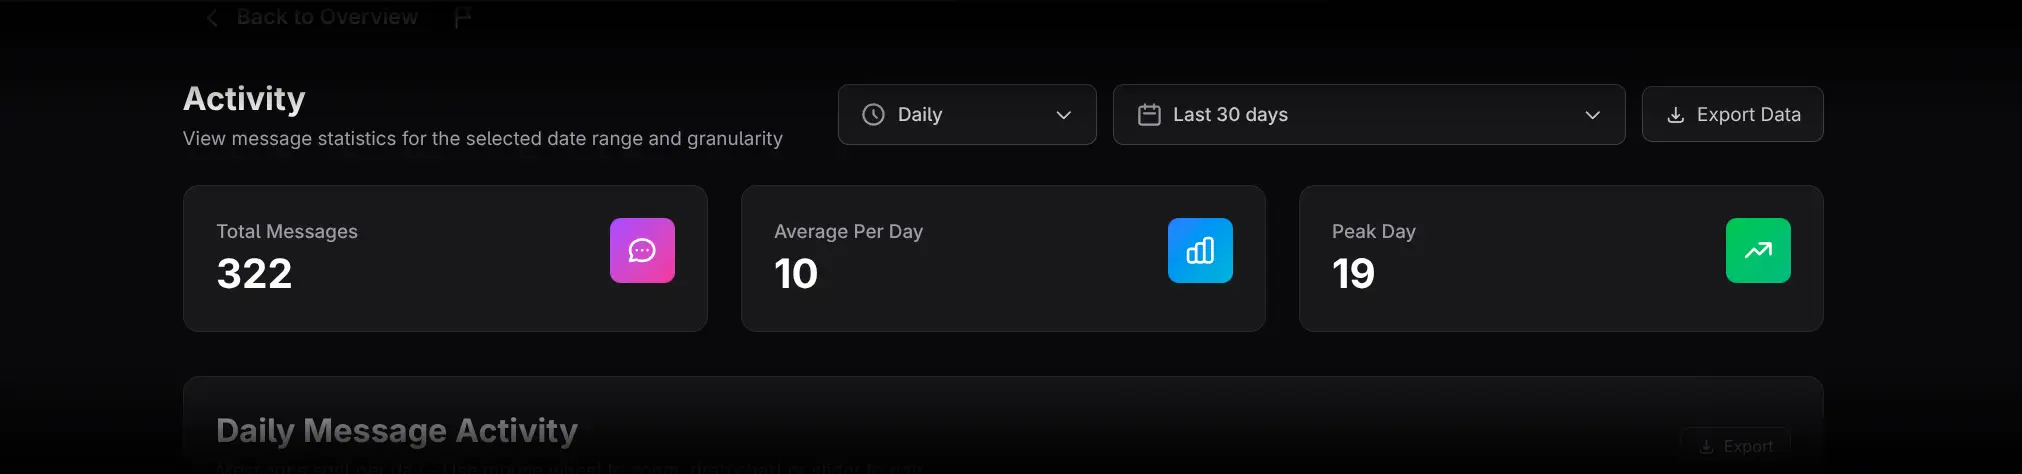
- Total Messages is the selected-period volume. Click it to open the server-wide Message Replay.
- Average Per Day normalizes the volume by day. Click it to open a ranked chart of members who contributed to the average.
- Peak Day identifies the highest-volume day. Click it to open the members responsible for that peak.
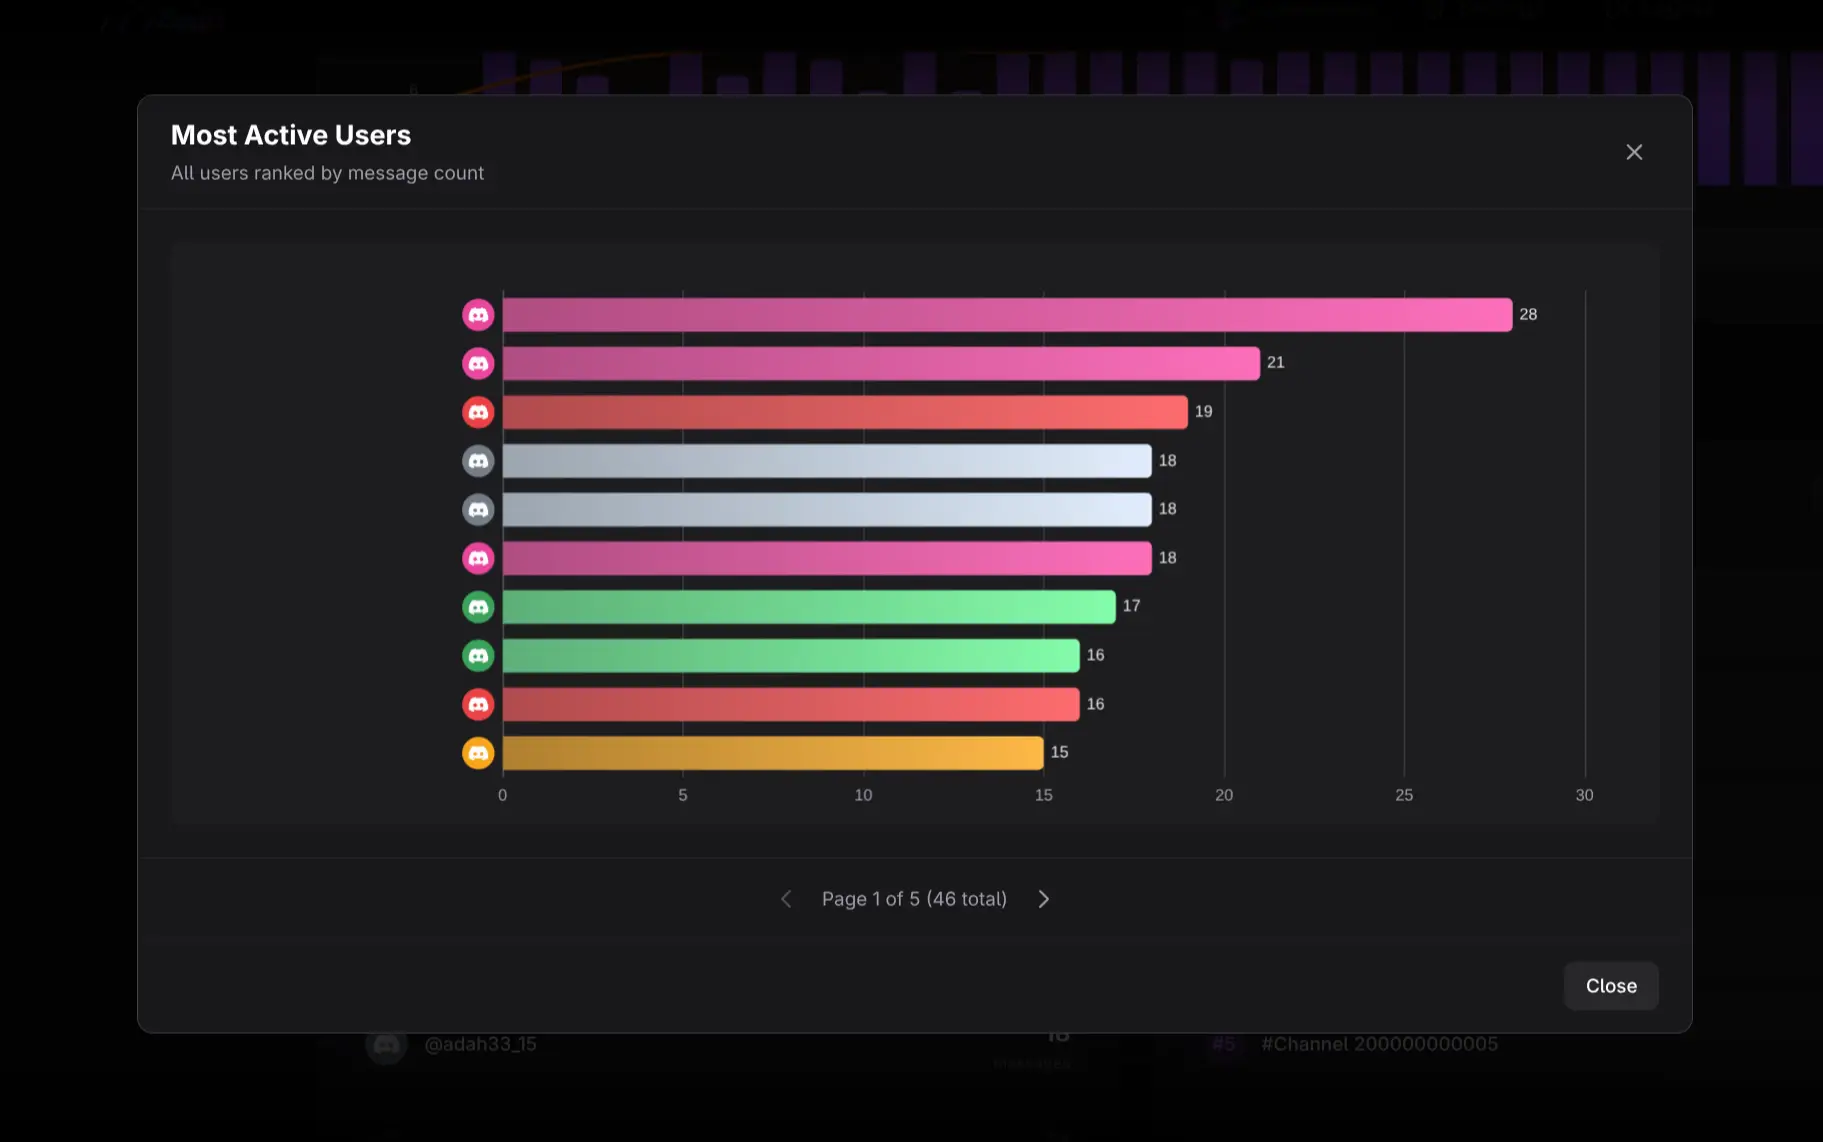
Member bars use colors sampled from their avatars. Click a bar to open Member Details.
Use privacy-preserving Message Replay
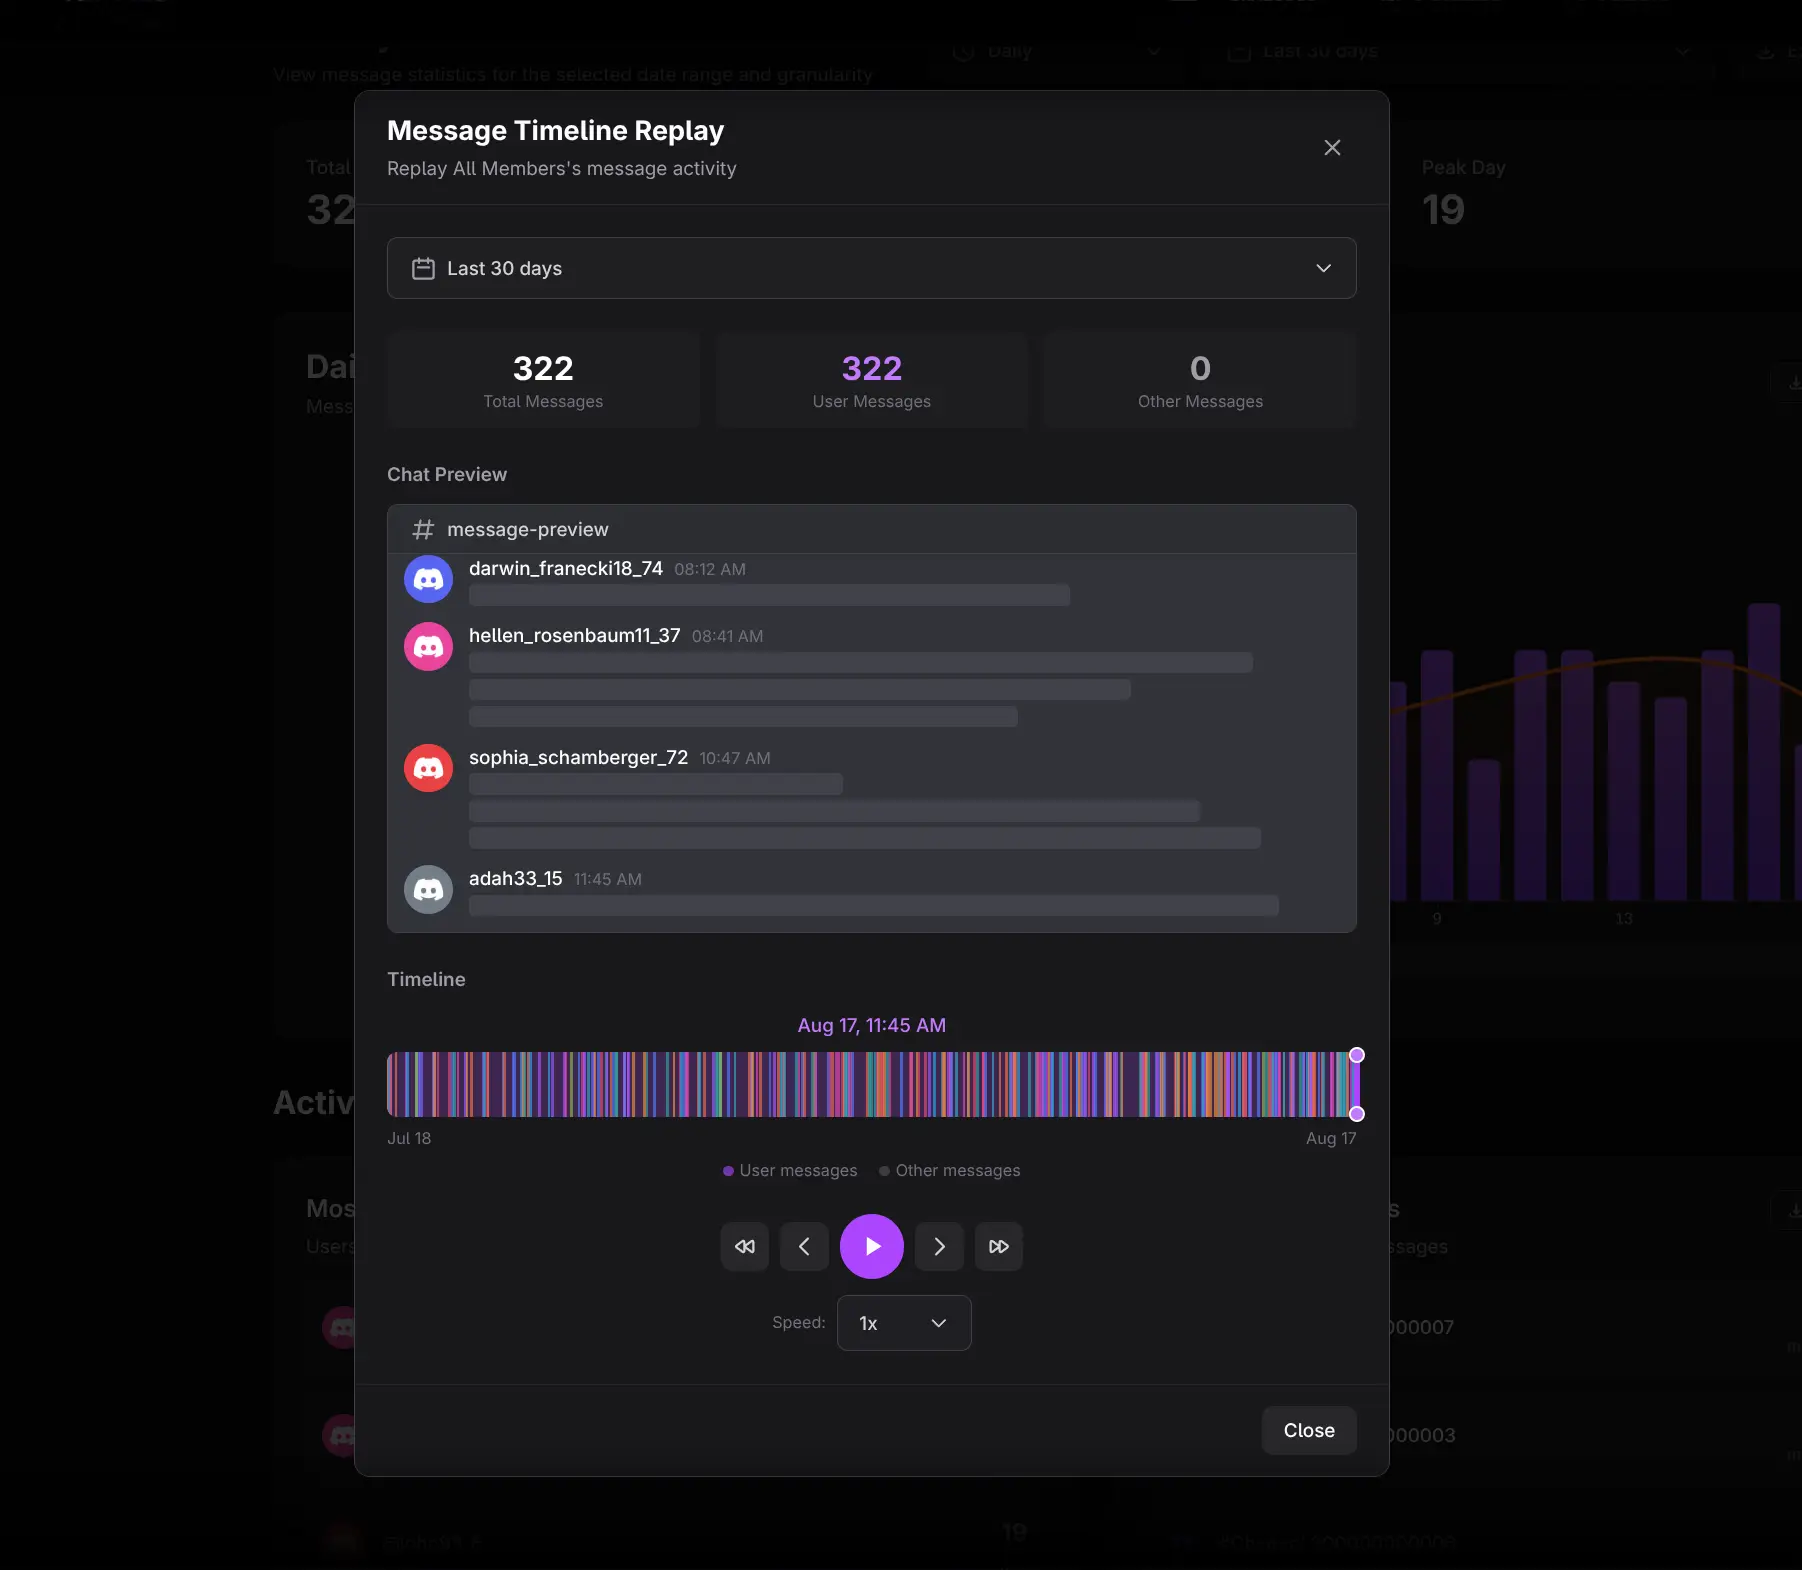
Message Replay helps reconstruct activity timing without exposing message content.
- Adjust the replay date range.
- Review Total, Target User, and Other Users message counts.
- Drag the timeline to move through events.
- Use Reset, Previous, Play/Pause, Next, and Skip to End.
- Set playback speed to 0.5×, 1×, 2×, or 4×.
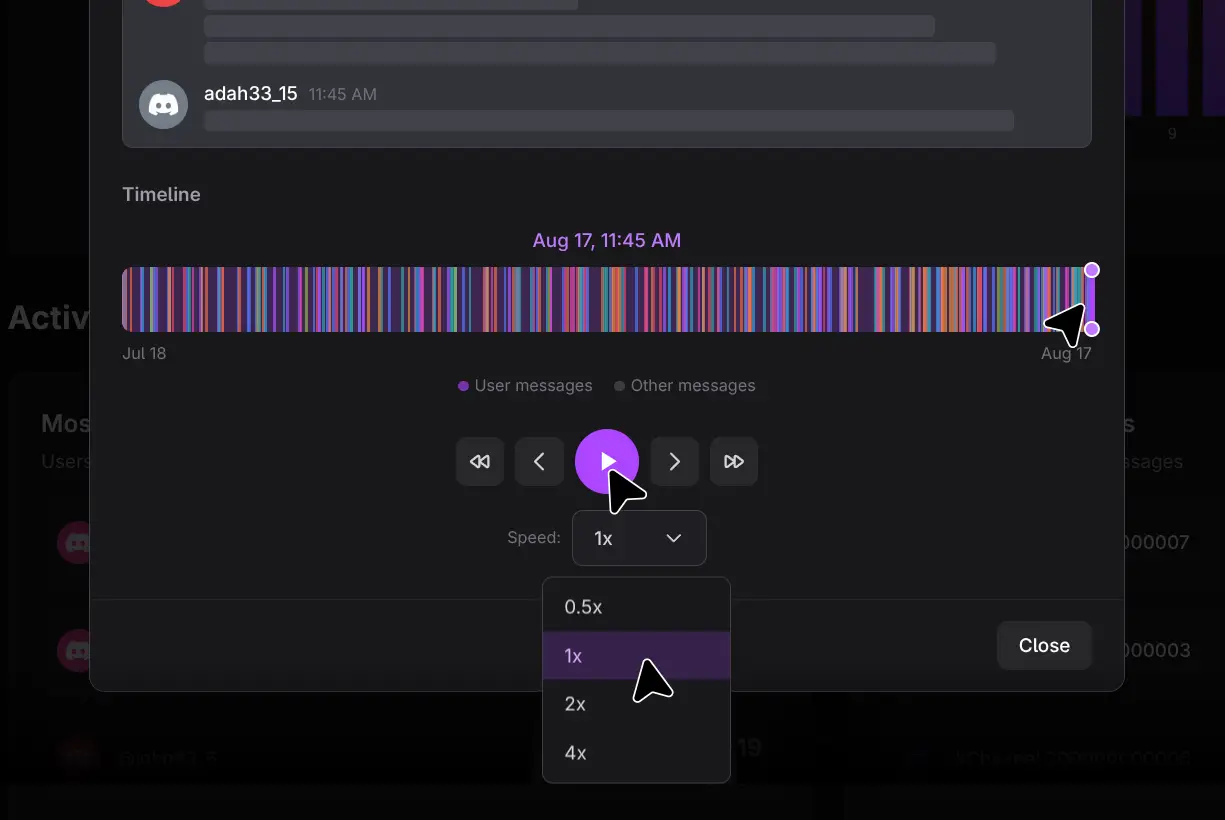
The preview shows timing and authorship; message text is never rendered.
Analyze Daily Message Activity
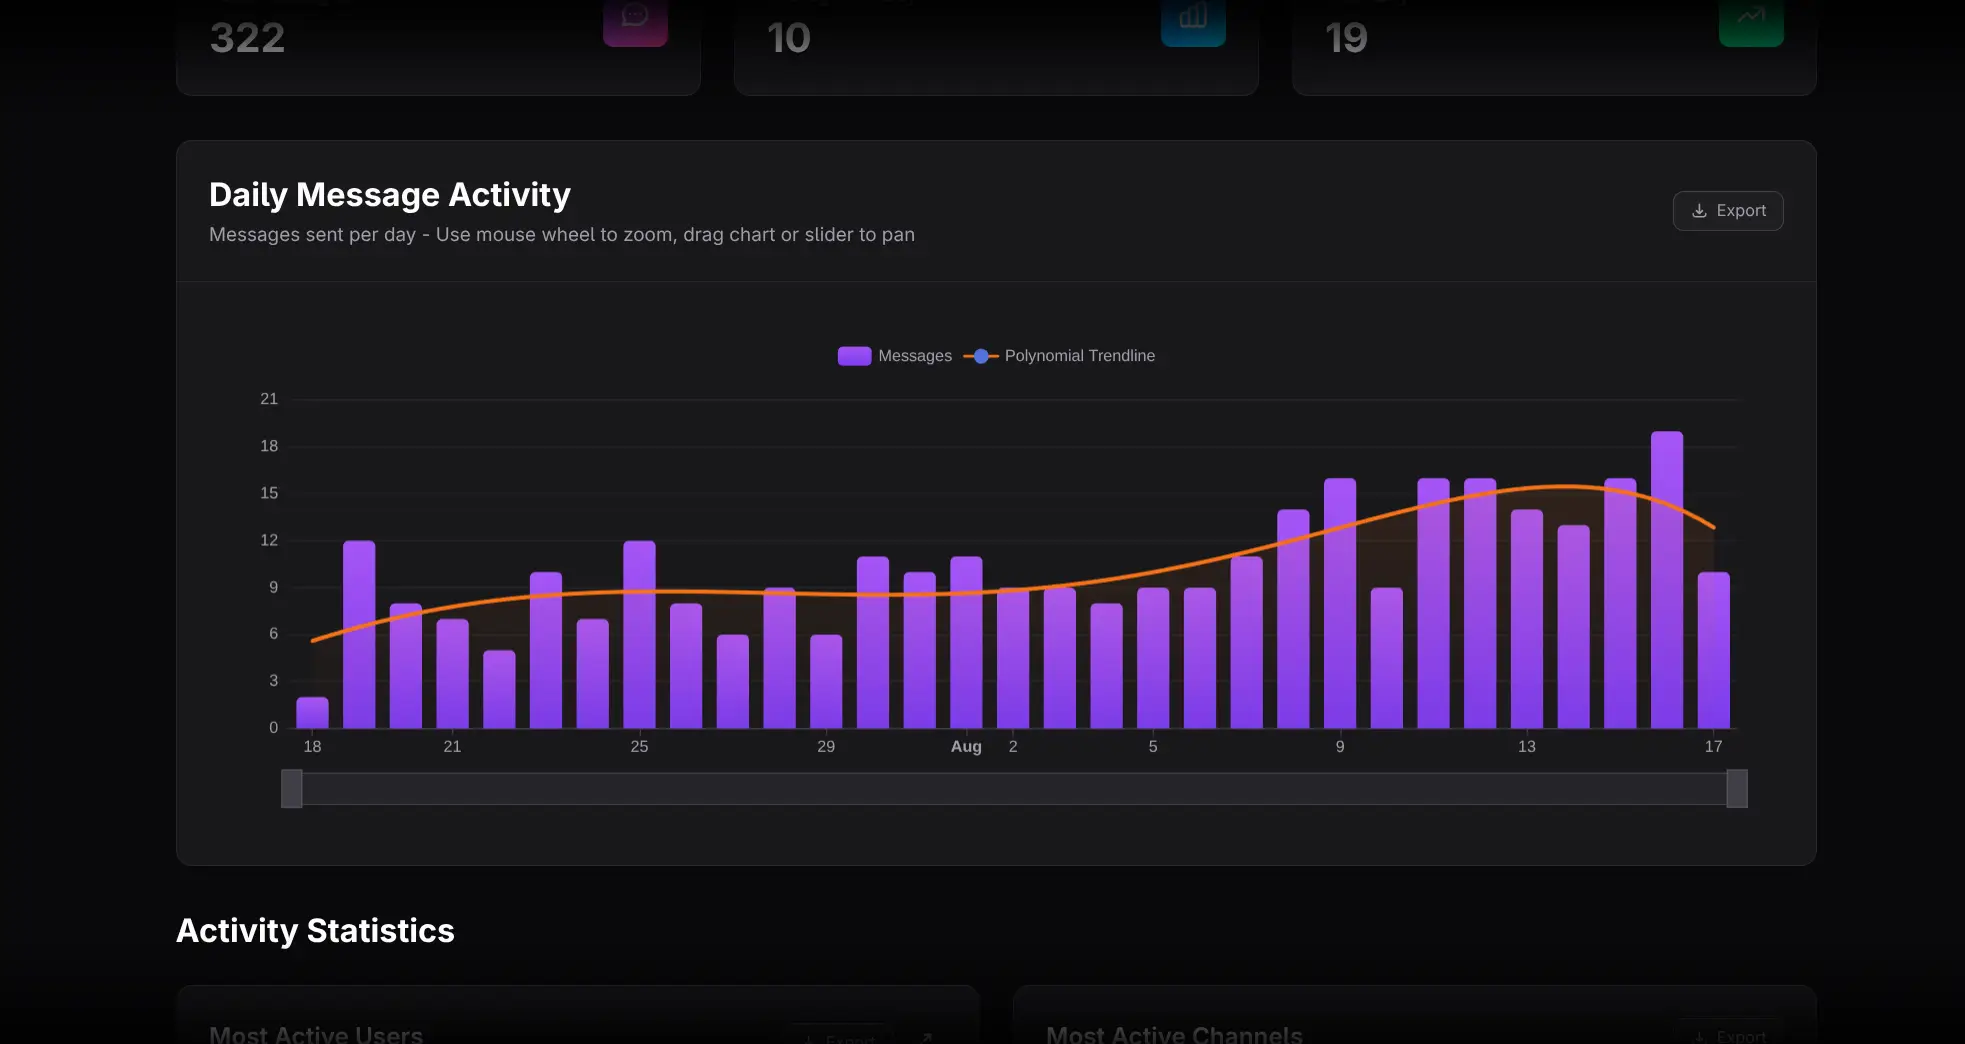
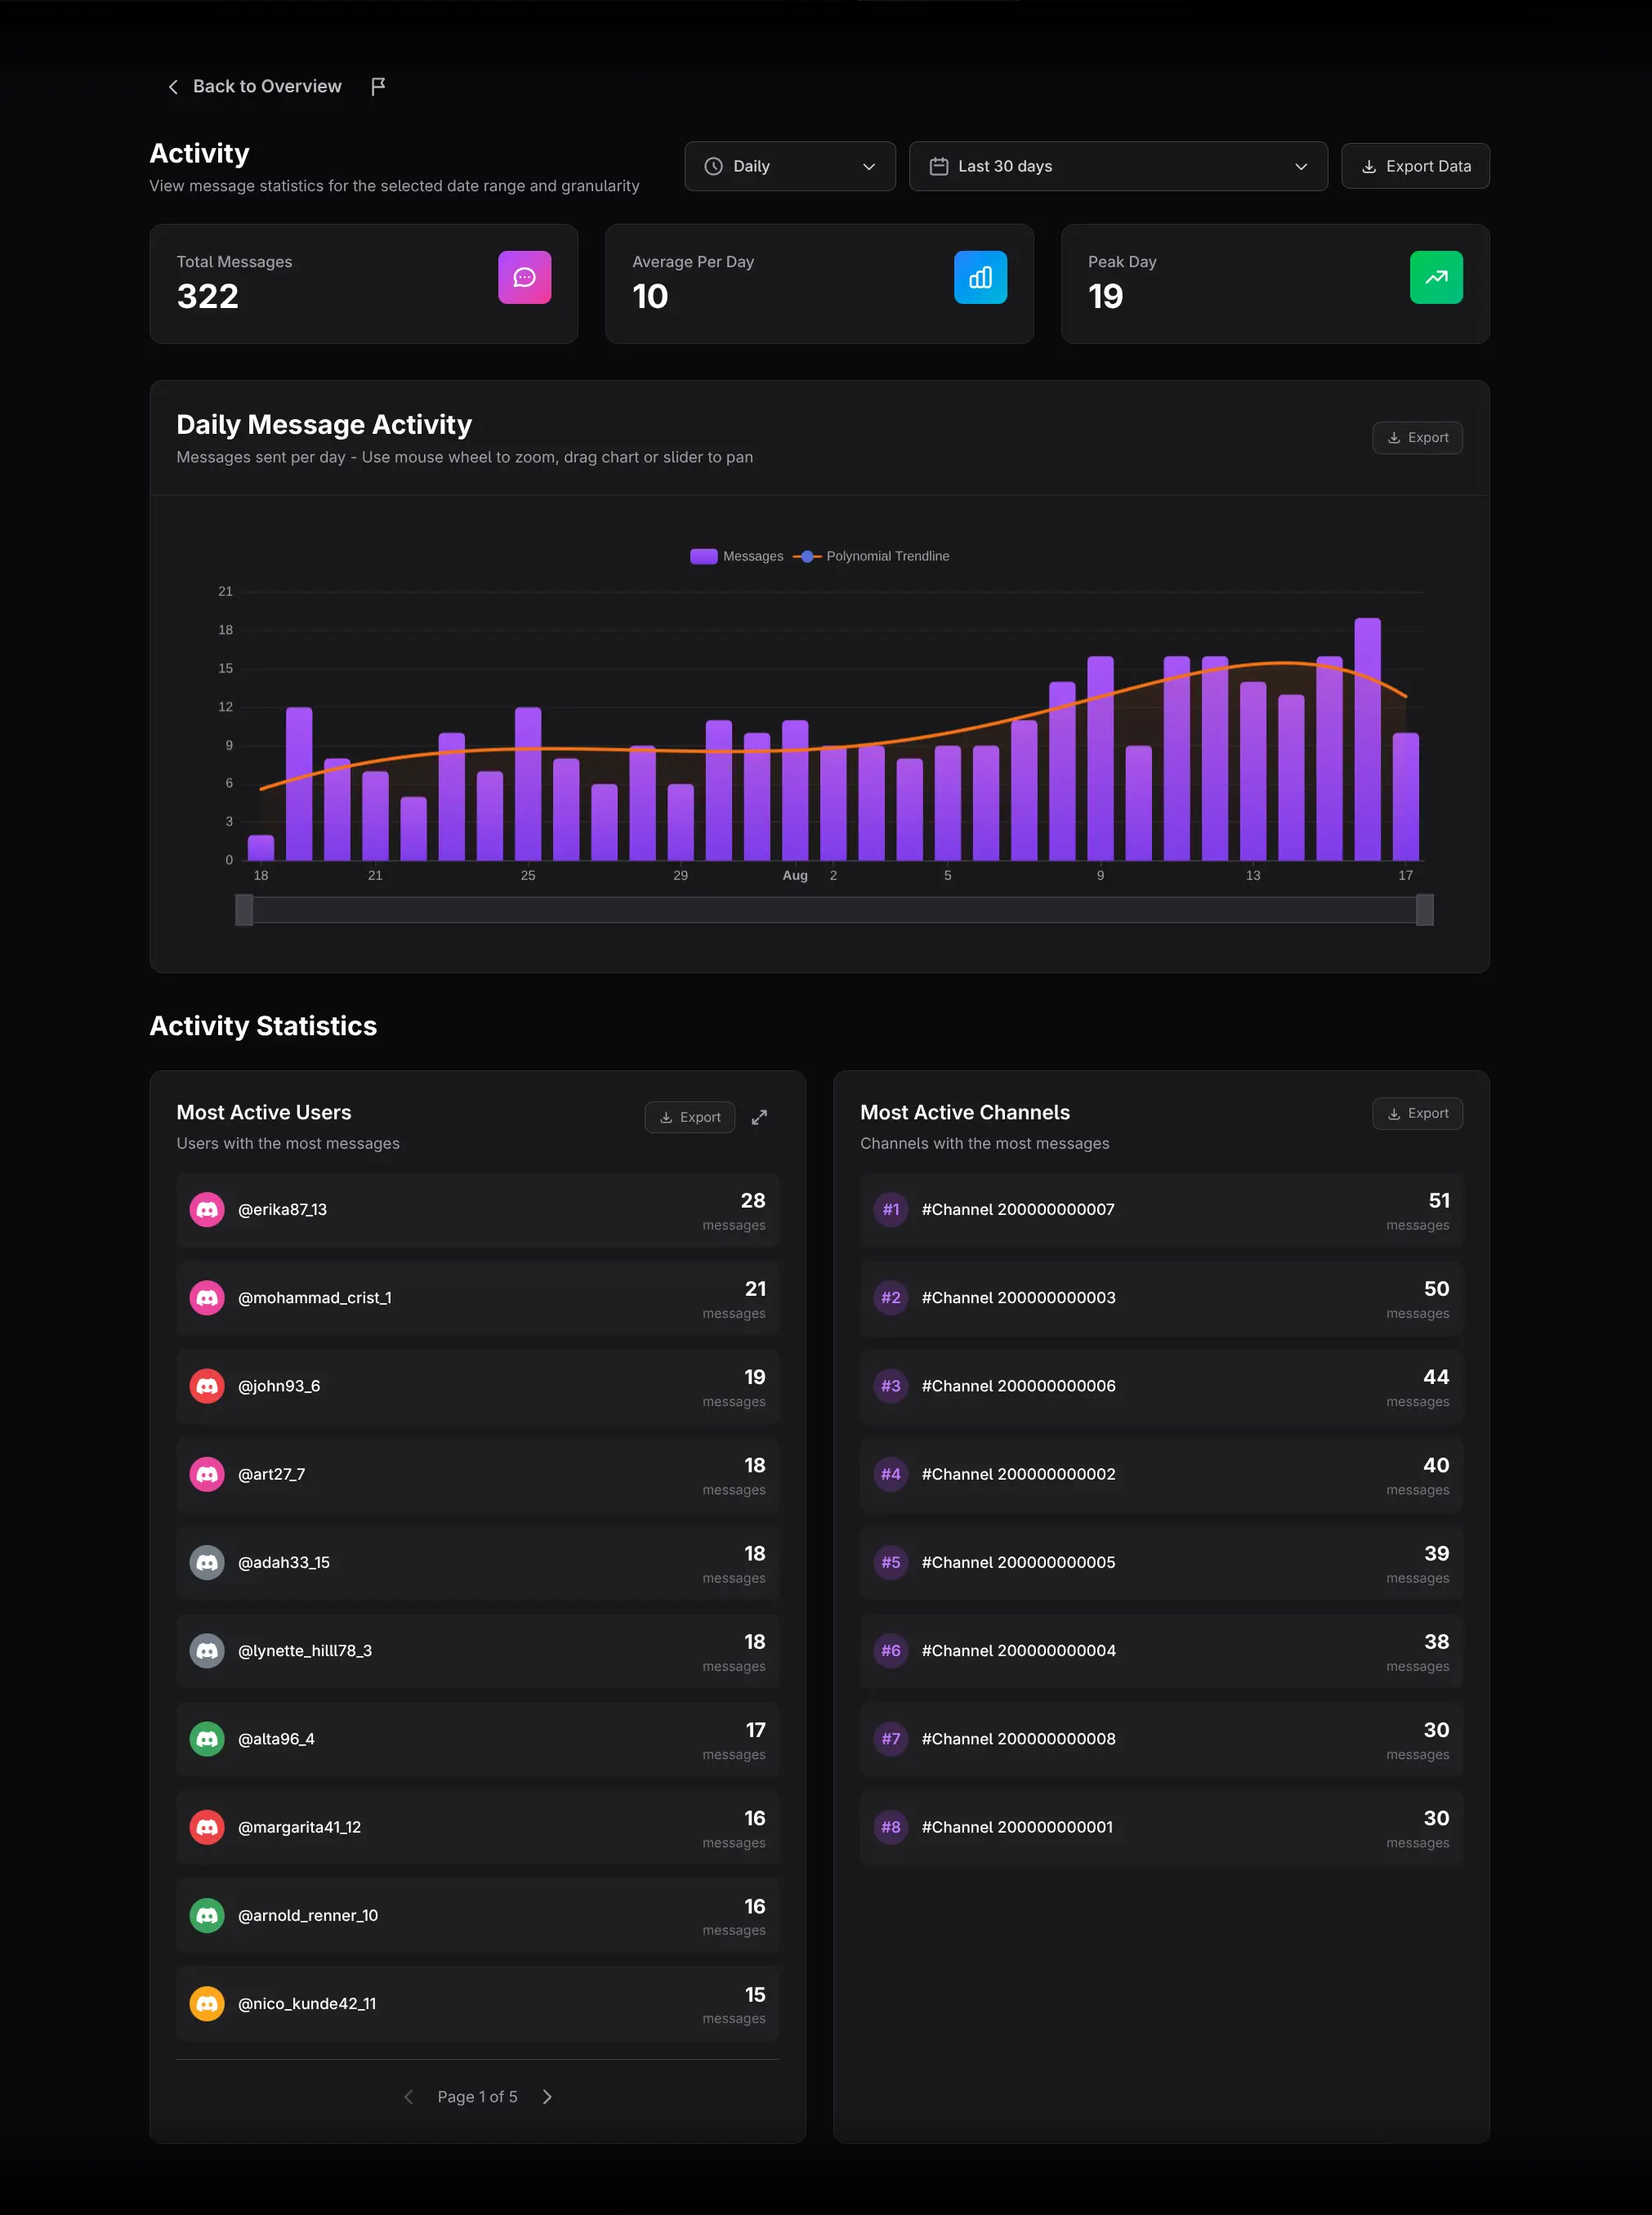
The chart combines message bars with a fitted trendline.
- Hover for exact bucket values.
- Zoom or drag to inspect a shorter interval.
- Treat faded dashed placeholder periods as missing or padded data, not observed zero-volume periods.
- Compare the bars with the trendline to distinguish isolated spikes from a directional change.
Review users and channels
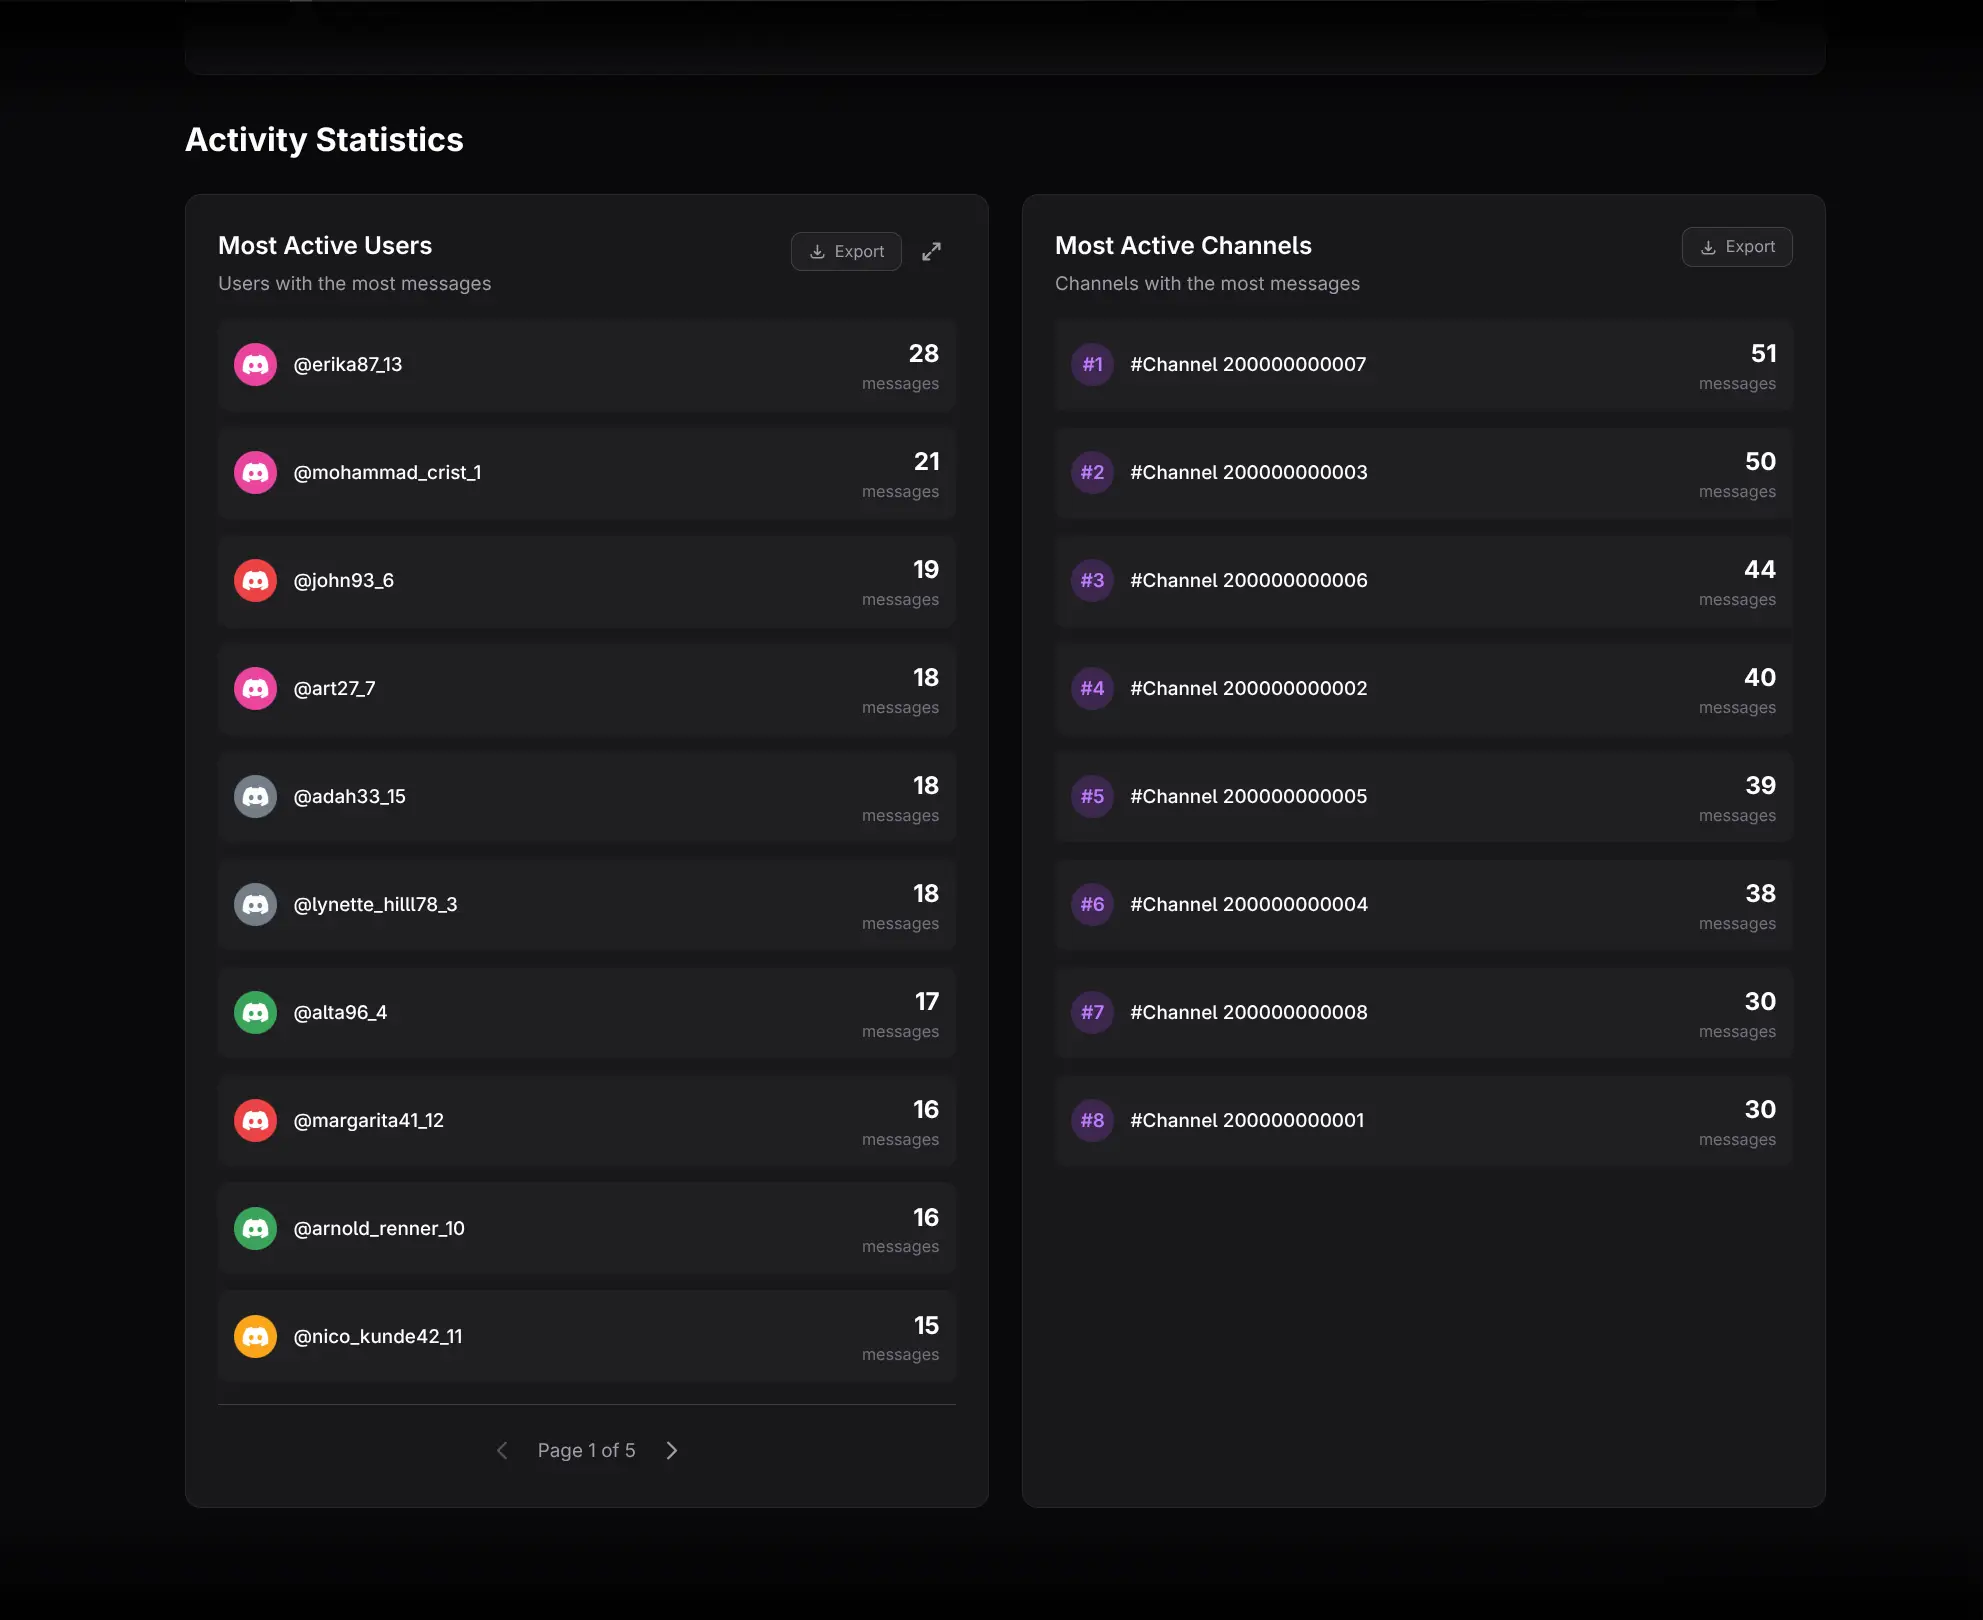
- Most Active Users opens a paginated top-50 member list. Click a user for Member Details. Use the expand icon for a large bar-chart ranking.
- Most Active Channels opens a paginated top-50 list. Channel rows are informational and do not open a channel detail page.
Practical workflows
Diagnose a spike
Set a narrow range around the spike, open Peak Day, and inspect the leading users. Use Message Replay to understand event timing, then compare the most active channels.
Measure broad engagement
Raw messages can be dominated by a few people. Compare this report with Chatting for unique senders and Activity Stability for returning participation.
Evaluate a content or event change
Compare equal-length periods with the same granularity. Look for changes in total volume, contributor concentration, and channel distribution.
Exporting and cautions
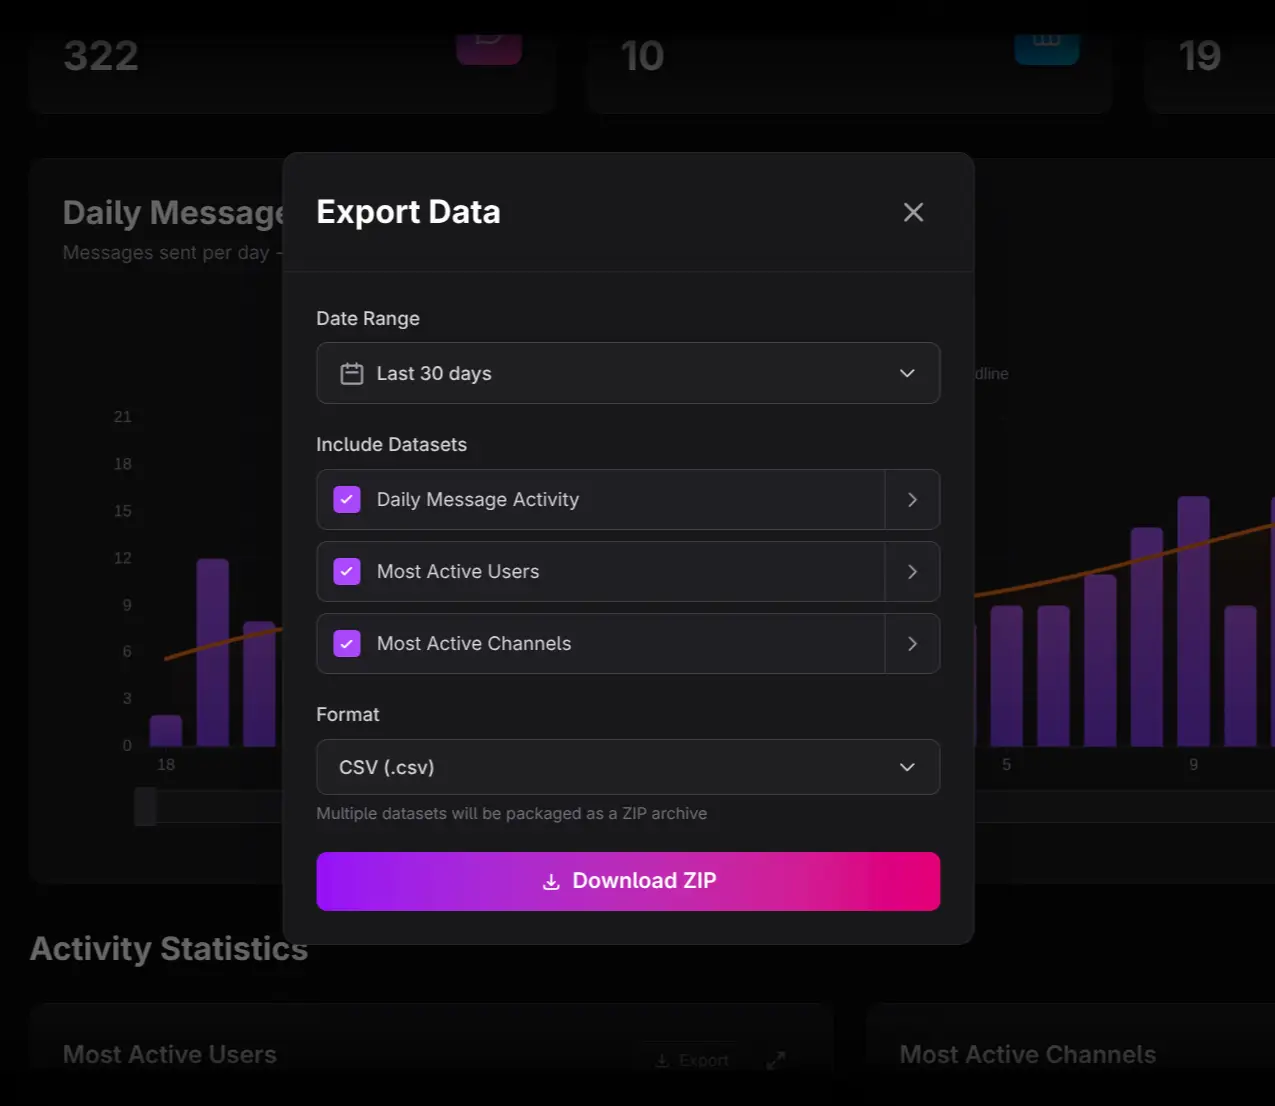
Use Export Data for multiple datasets or a chart-level Export button for one section.
- Message volume measures output, not sentiment or quality.
- A higher average can be caused by one exceptional day.
- Missing tracked periods should not be treated as true inactivity.
- Message Replay deliberately does not reproduce message content.