Growth
Learn how to analyze member joins, departures, net growth, and leave speed.
The Growth report explains how the server's membership changed over time: who joined, who left, the resulting net change, and how quickly departing members left after joining.
Choose the analysis period
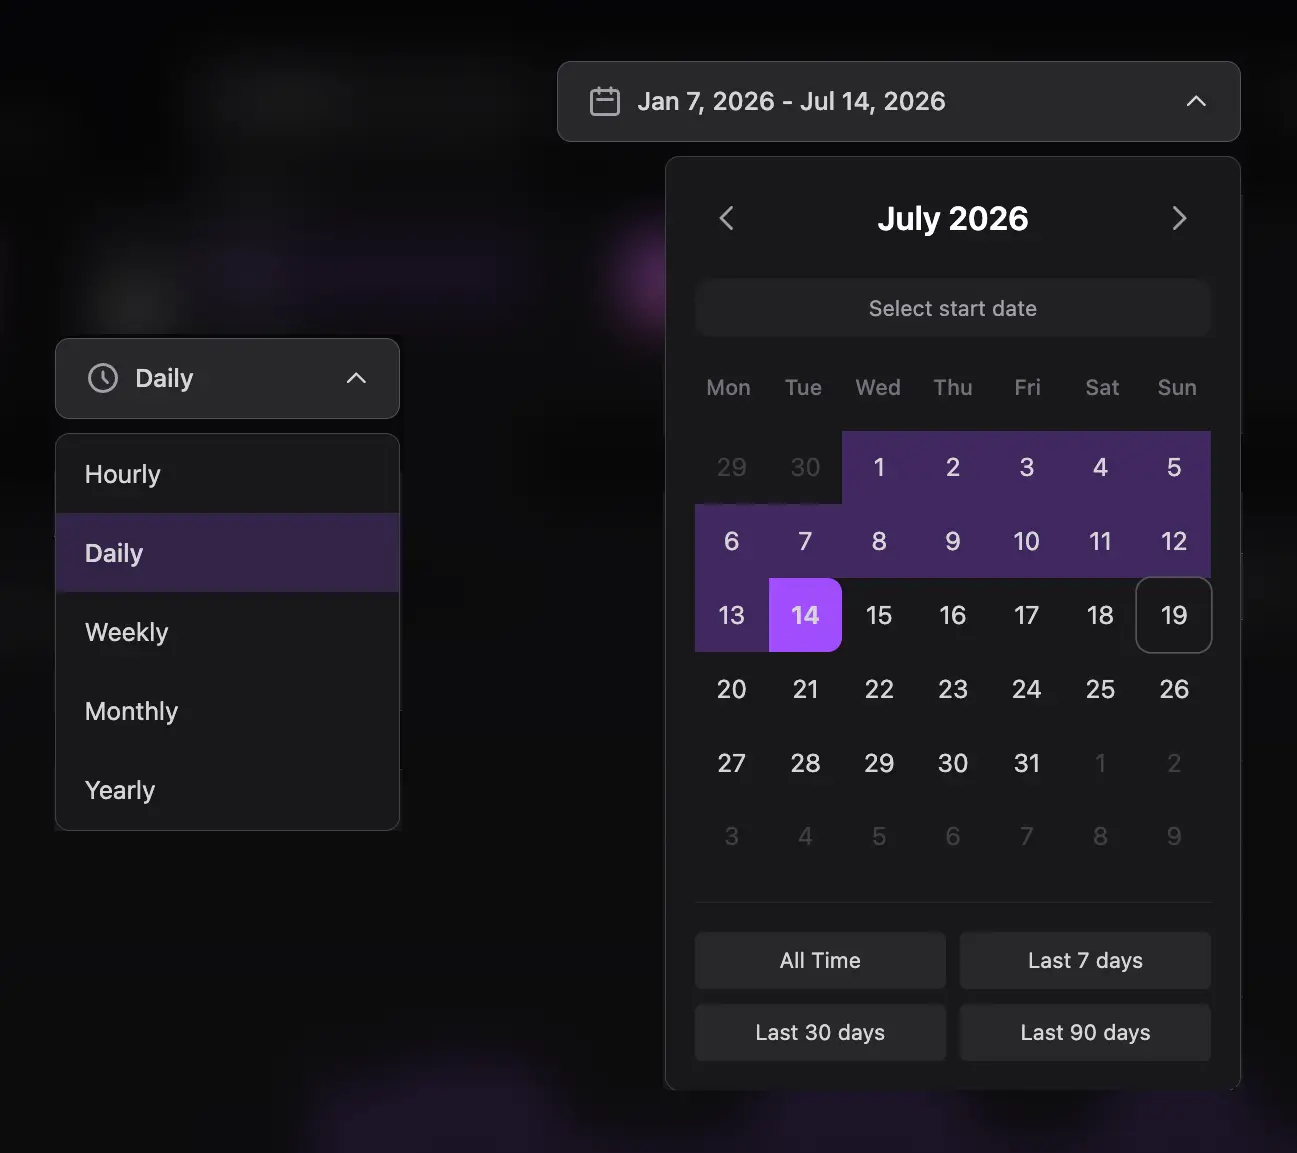
- Select Hourly, Daily, Weekly, Monthly, or Yearly granularity.
- Open the date picker and choose a start and end date, or use Last 7 Days, Last 30 Days, Last 90 Days, or All Time when available.
- Use a smaller granularity for short operational reviews and a larger one for long-term direction.
Read the summary cards
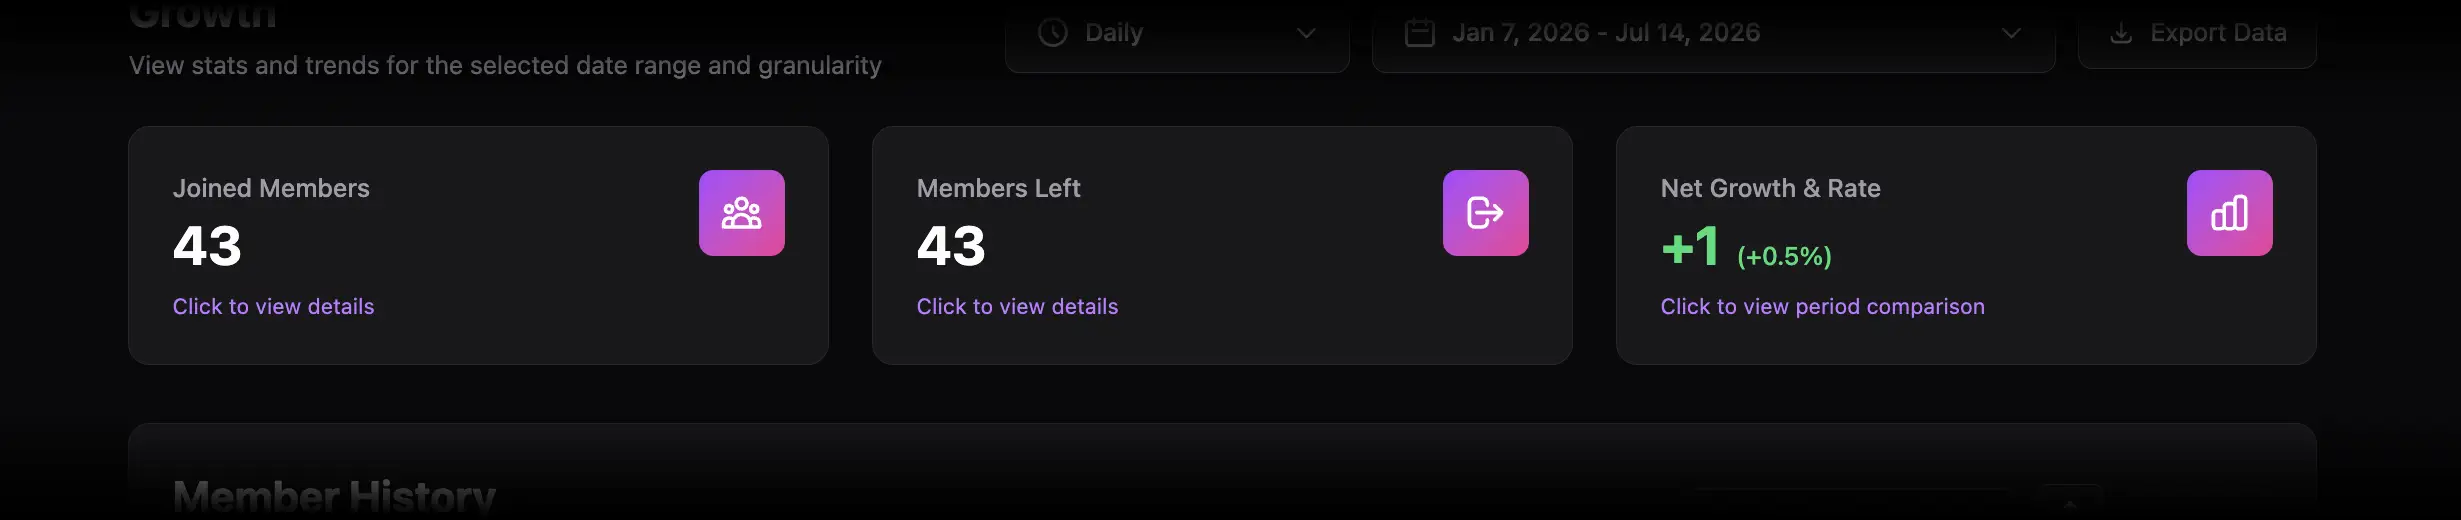
- Joined Members: total join events in the selected period. Click to see the members who joined.
- Members Left: total leave events. Click to inspect departures.
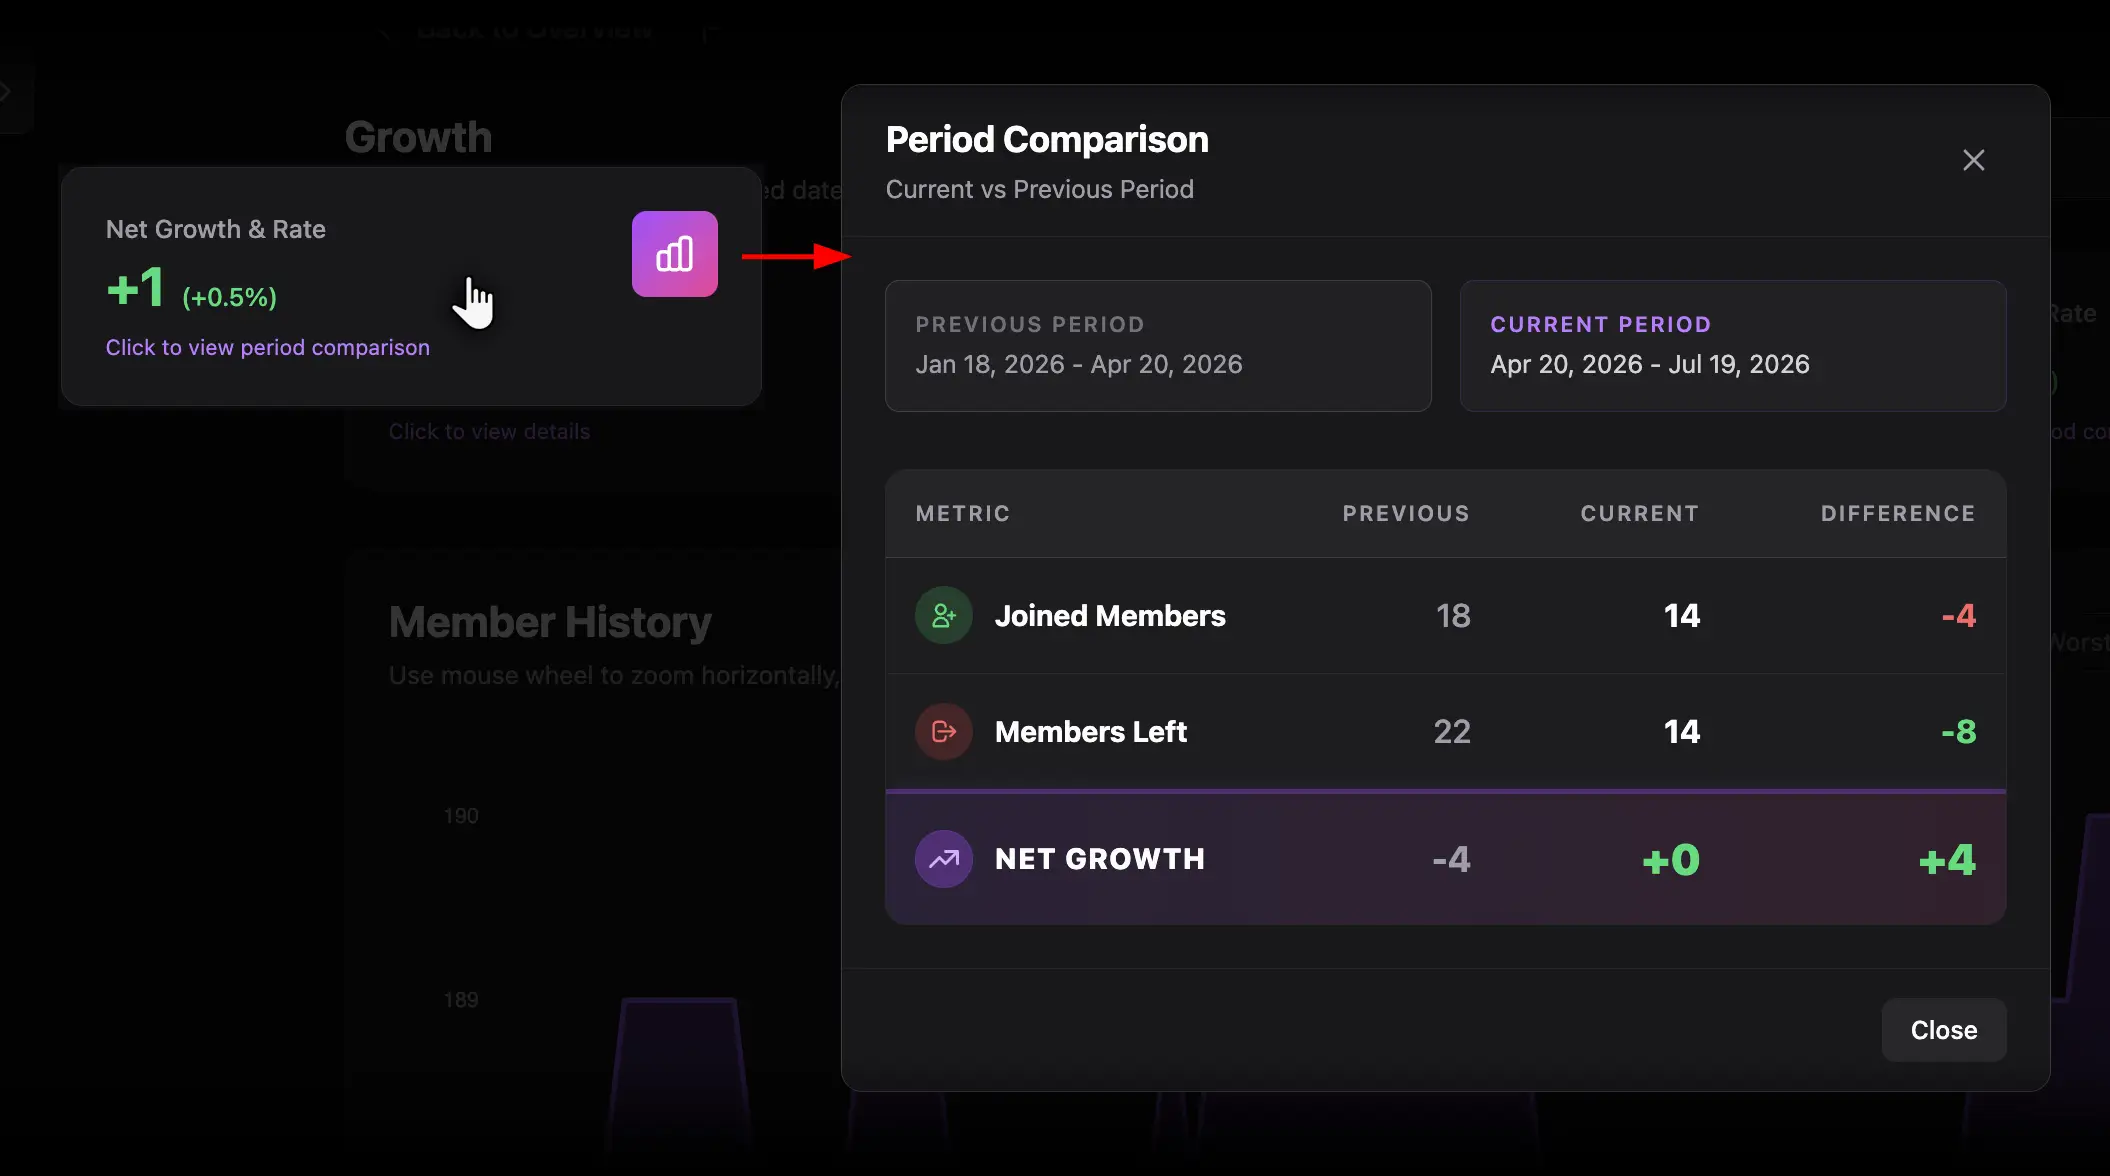
- Net Growth & Rate: joins minus leaves and the corresponding growth rate. Click to compare the selected period with the immediately preceding period of equal length.
In Period Comparison, review Joined Members, Members Left, and Net Growth across Previous, Current, and Difference columns. This separates stronger acquisition from improved retention: the same net result can come from very different join and leave behavior.
Work with Member History
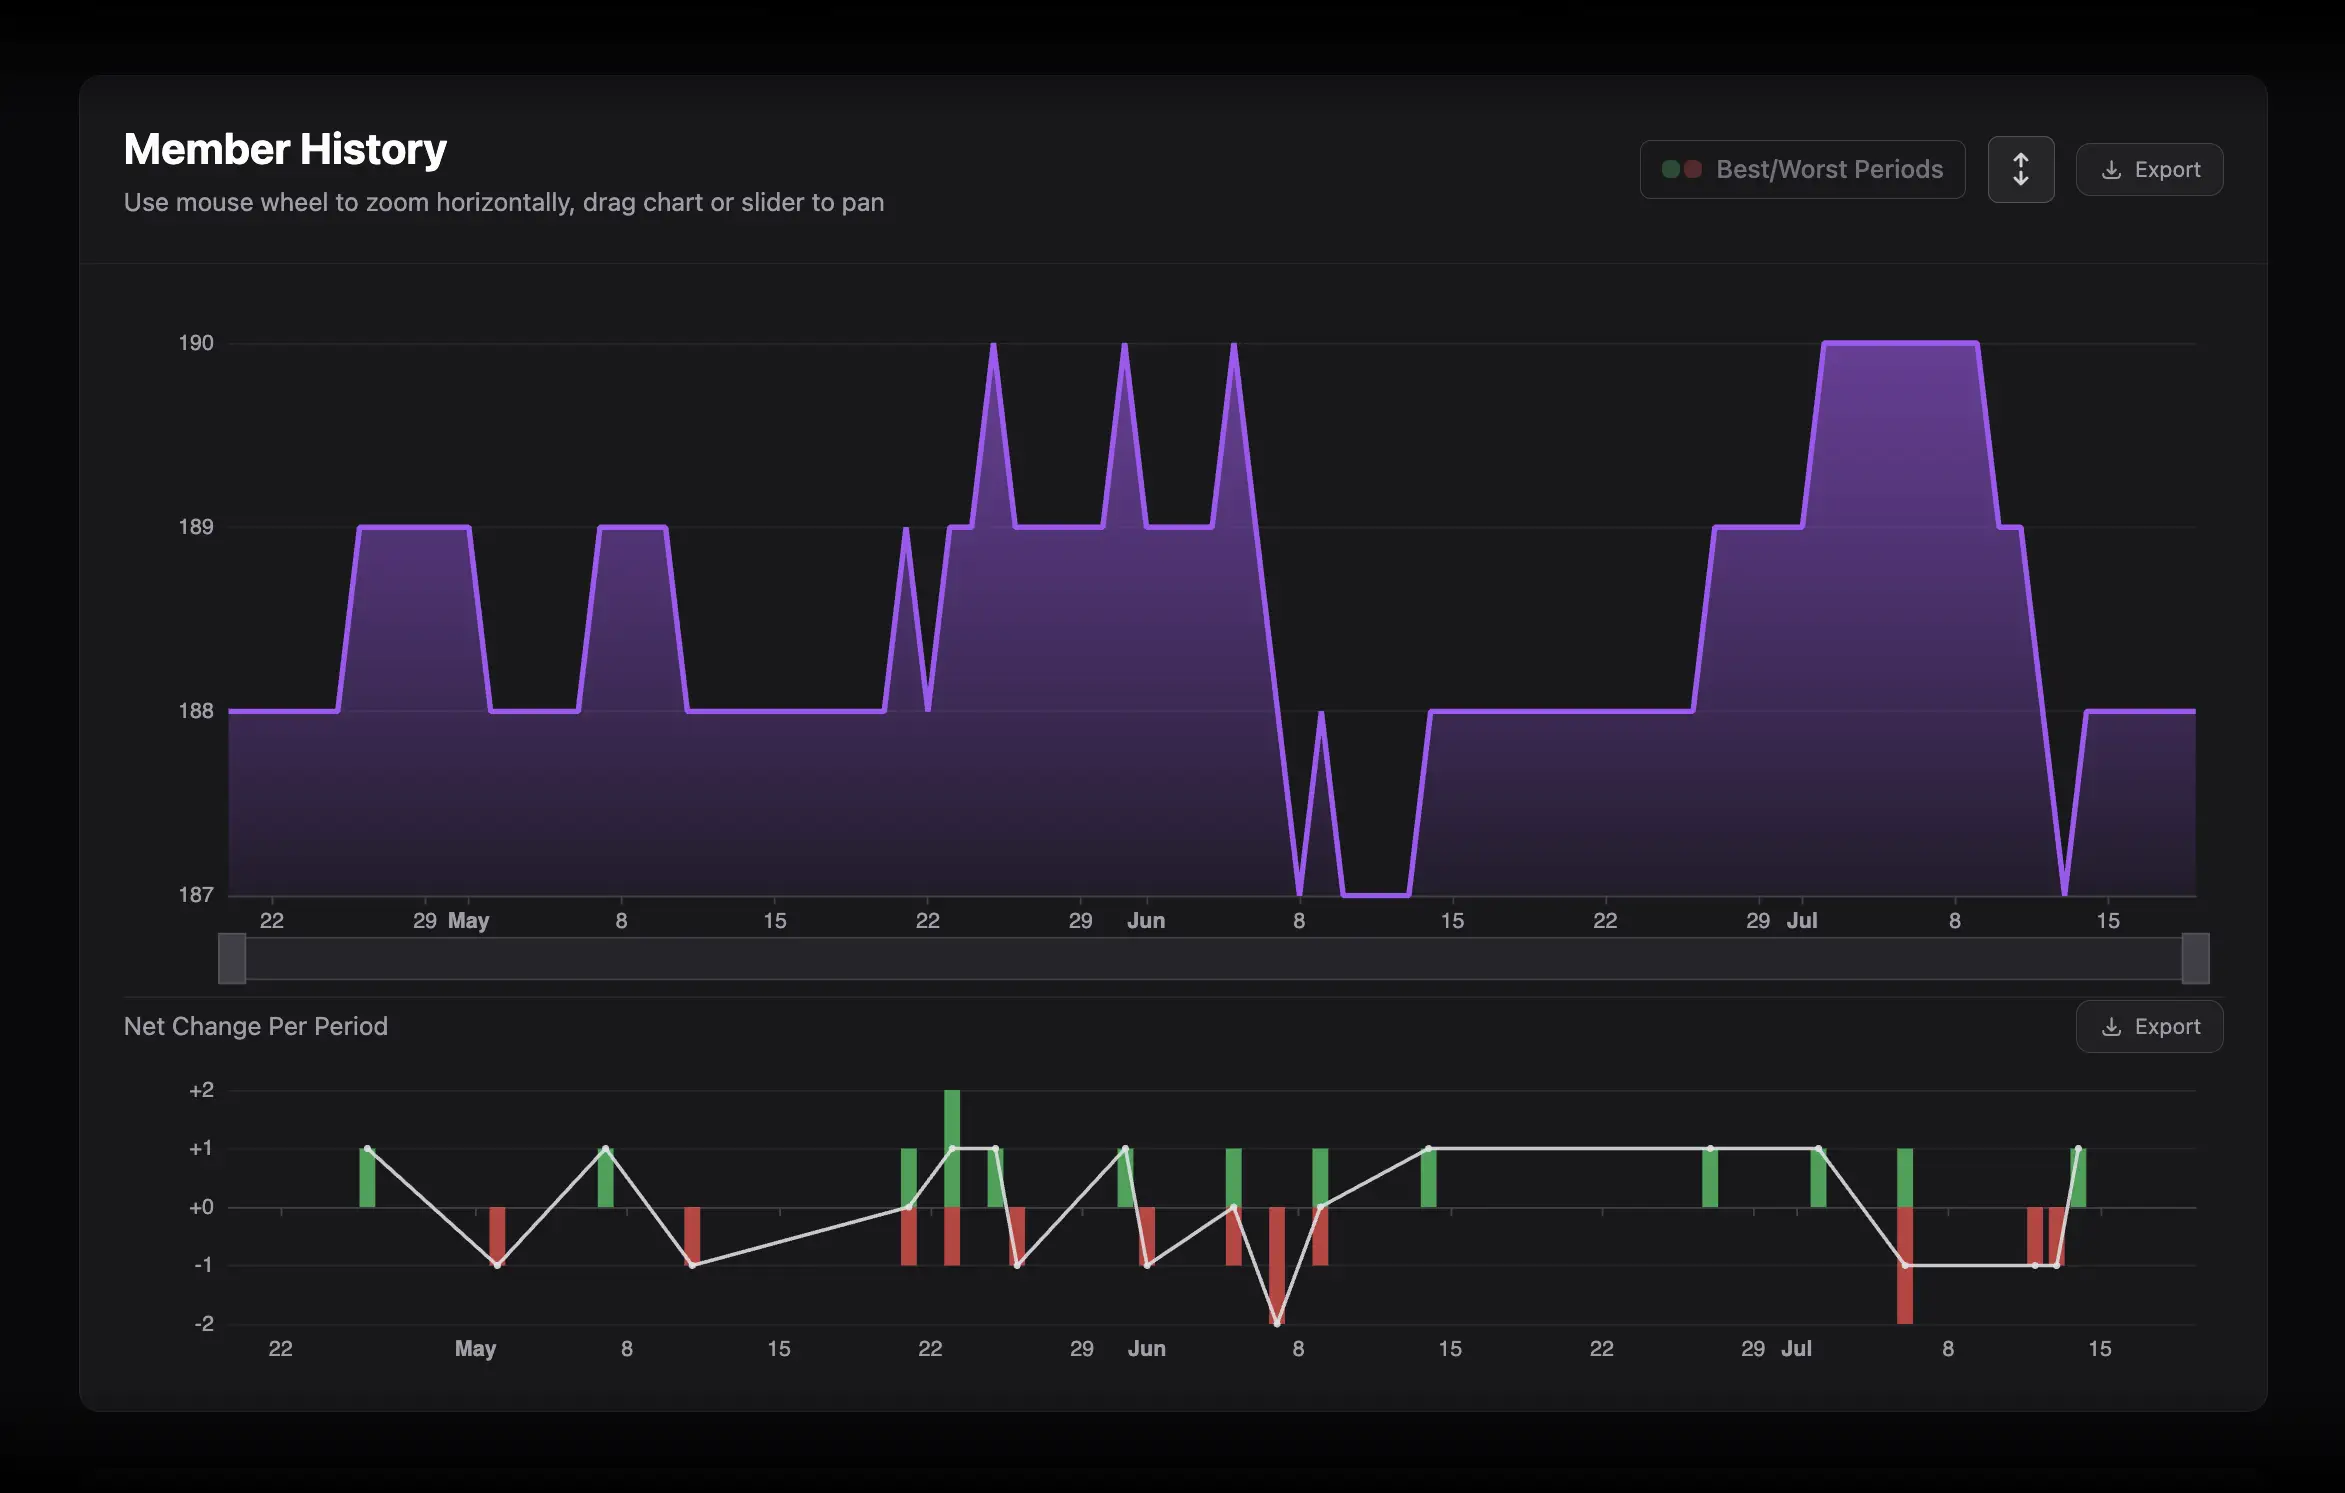
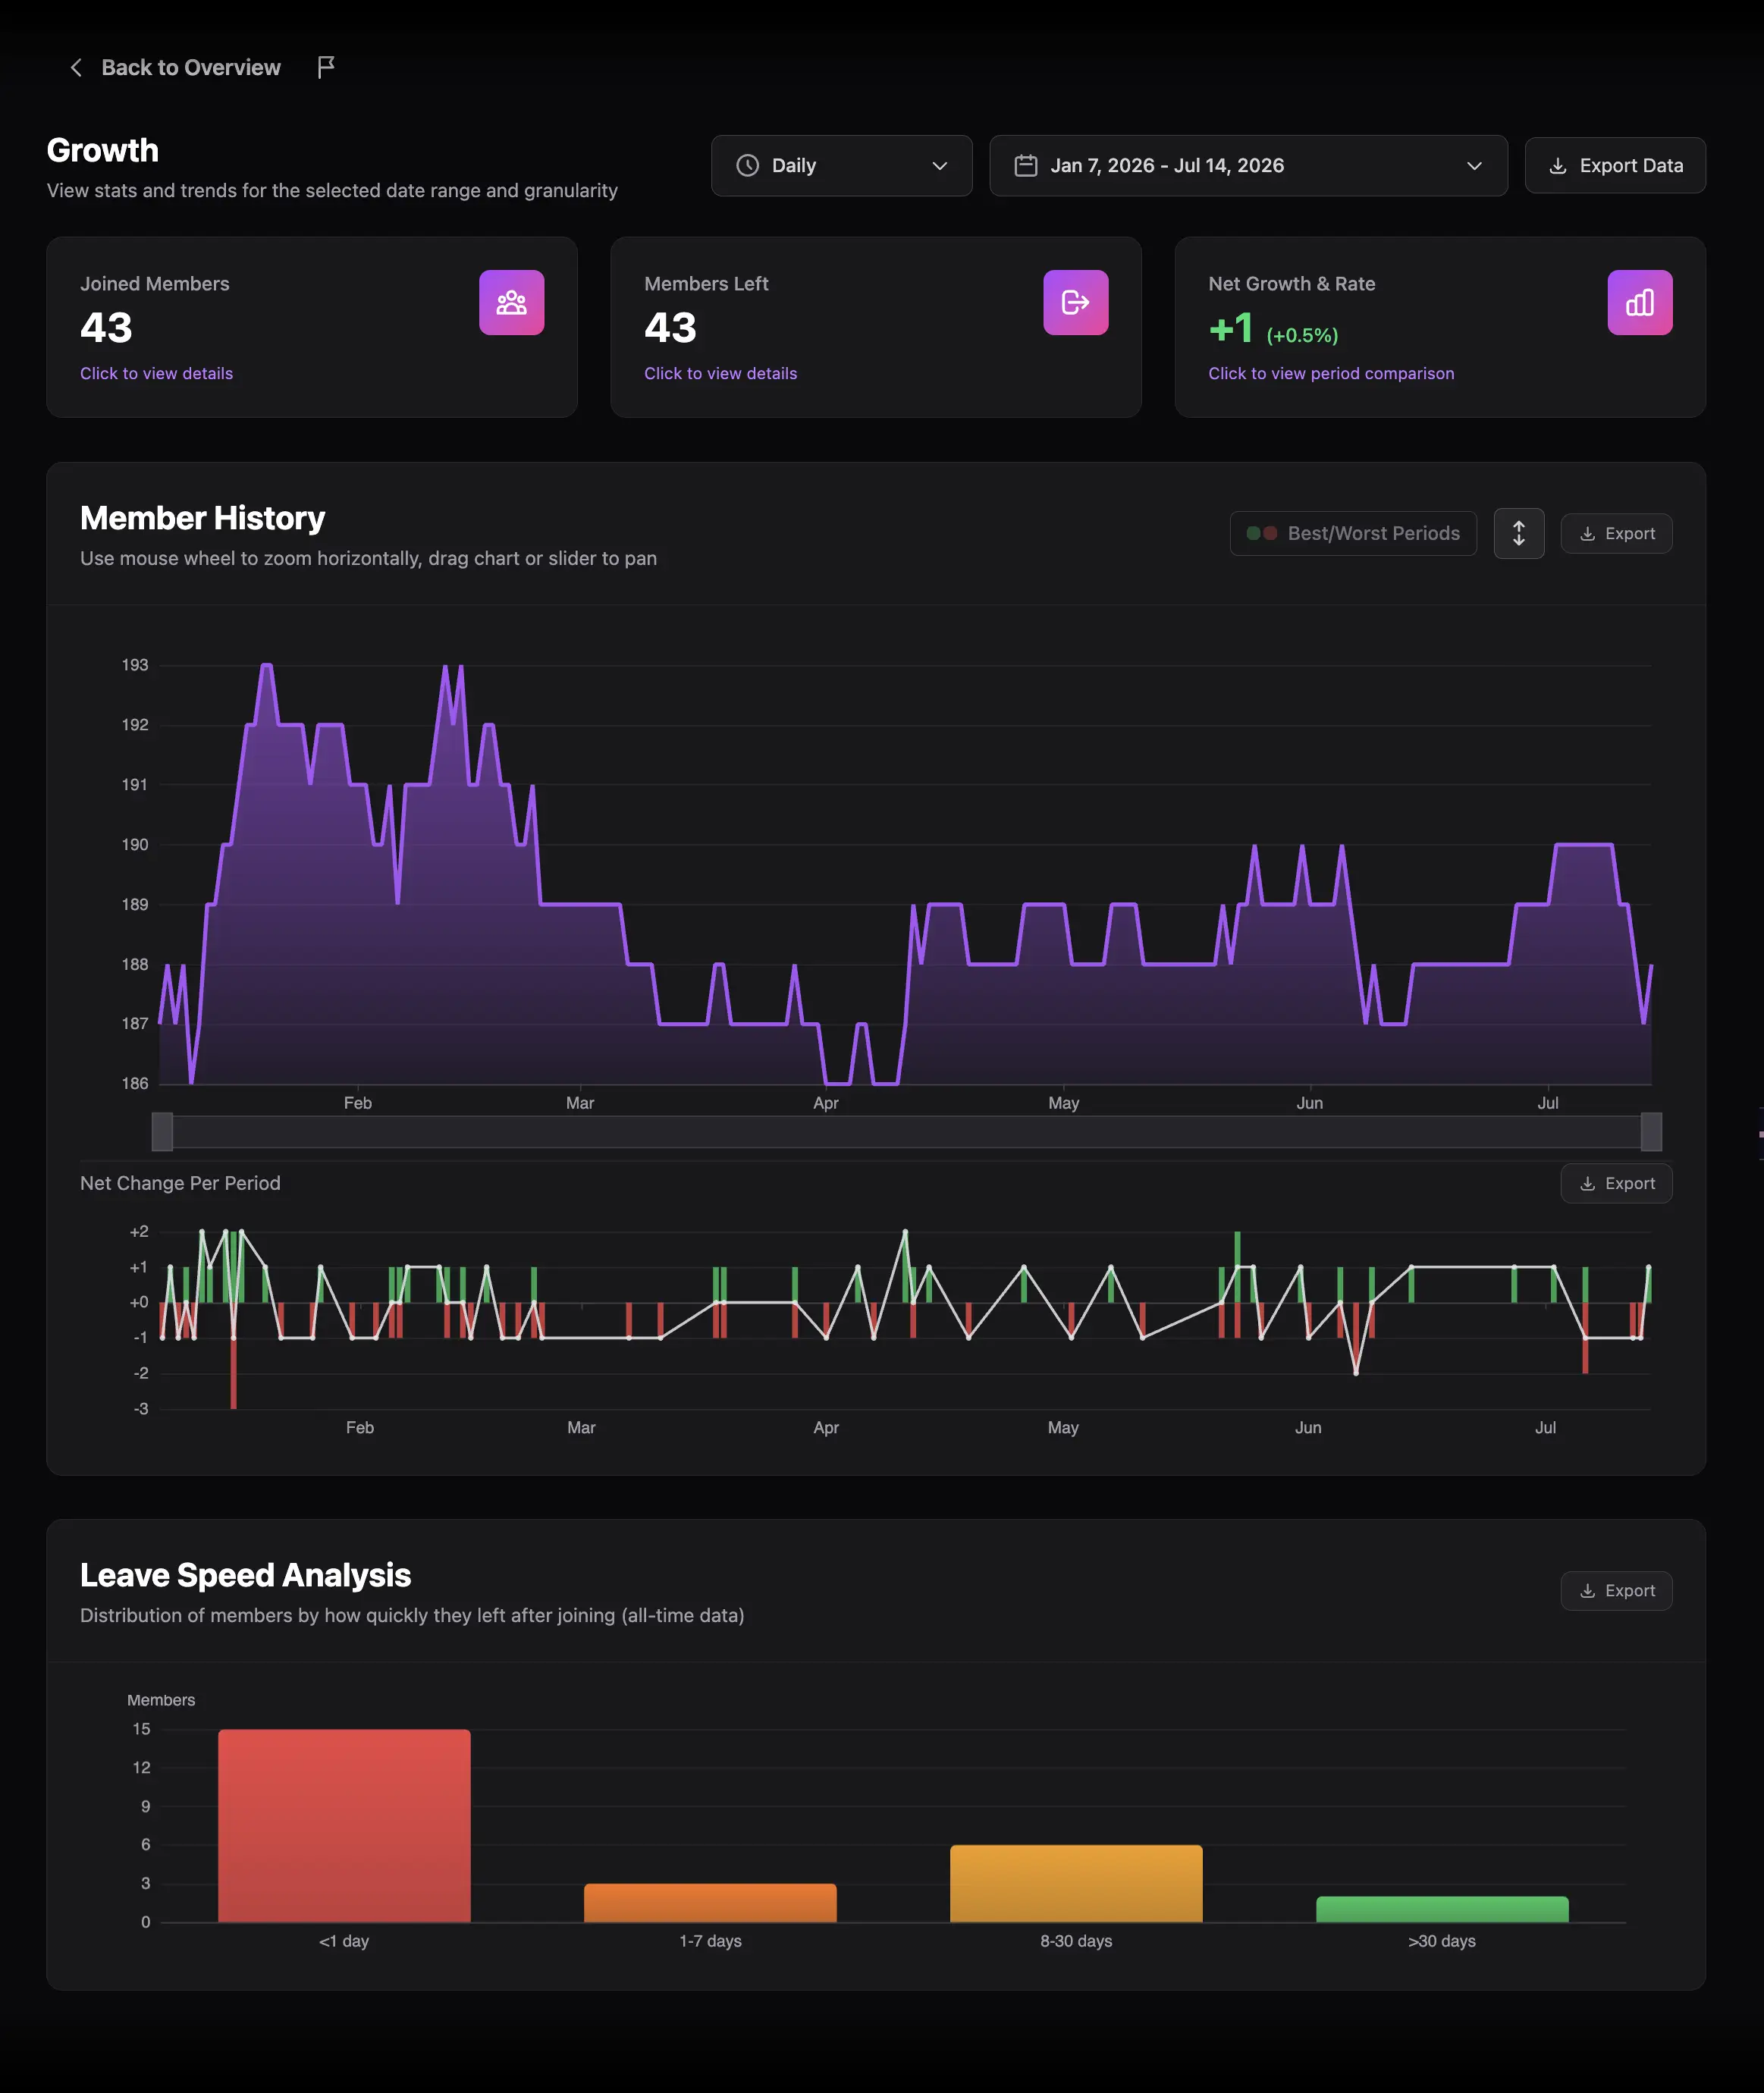
The upper panel shows total membership as a purple line and area. The lower panel shows green joins, red leaves, and a net-change line for each time bucket.
- Hover to inspect exact values.
- Zoom or drag horizontally to focus on an interval. Use Reset Zoom when finished.
- Switch the vertical scale between Normalized and Raw. Normalized makes small changes easier to see; Raw preserves the zero-based scale and better communicates magnitude.
- Enable Best/Worst Periods to highlight the strongest contiguous growth streak and the weakest decline streak.
- Click a bar in the lower panel. Above zero opens joins for that bucket; below zero opens leaves; a zero-line bucket containing both can show both types.
- Click a member in the resulting list to open Member Details.

Analyze leave speed
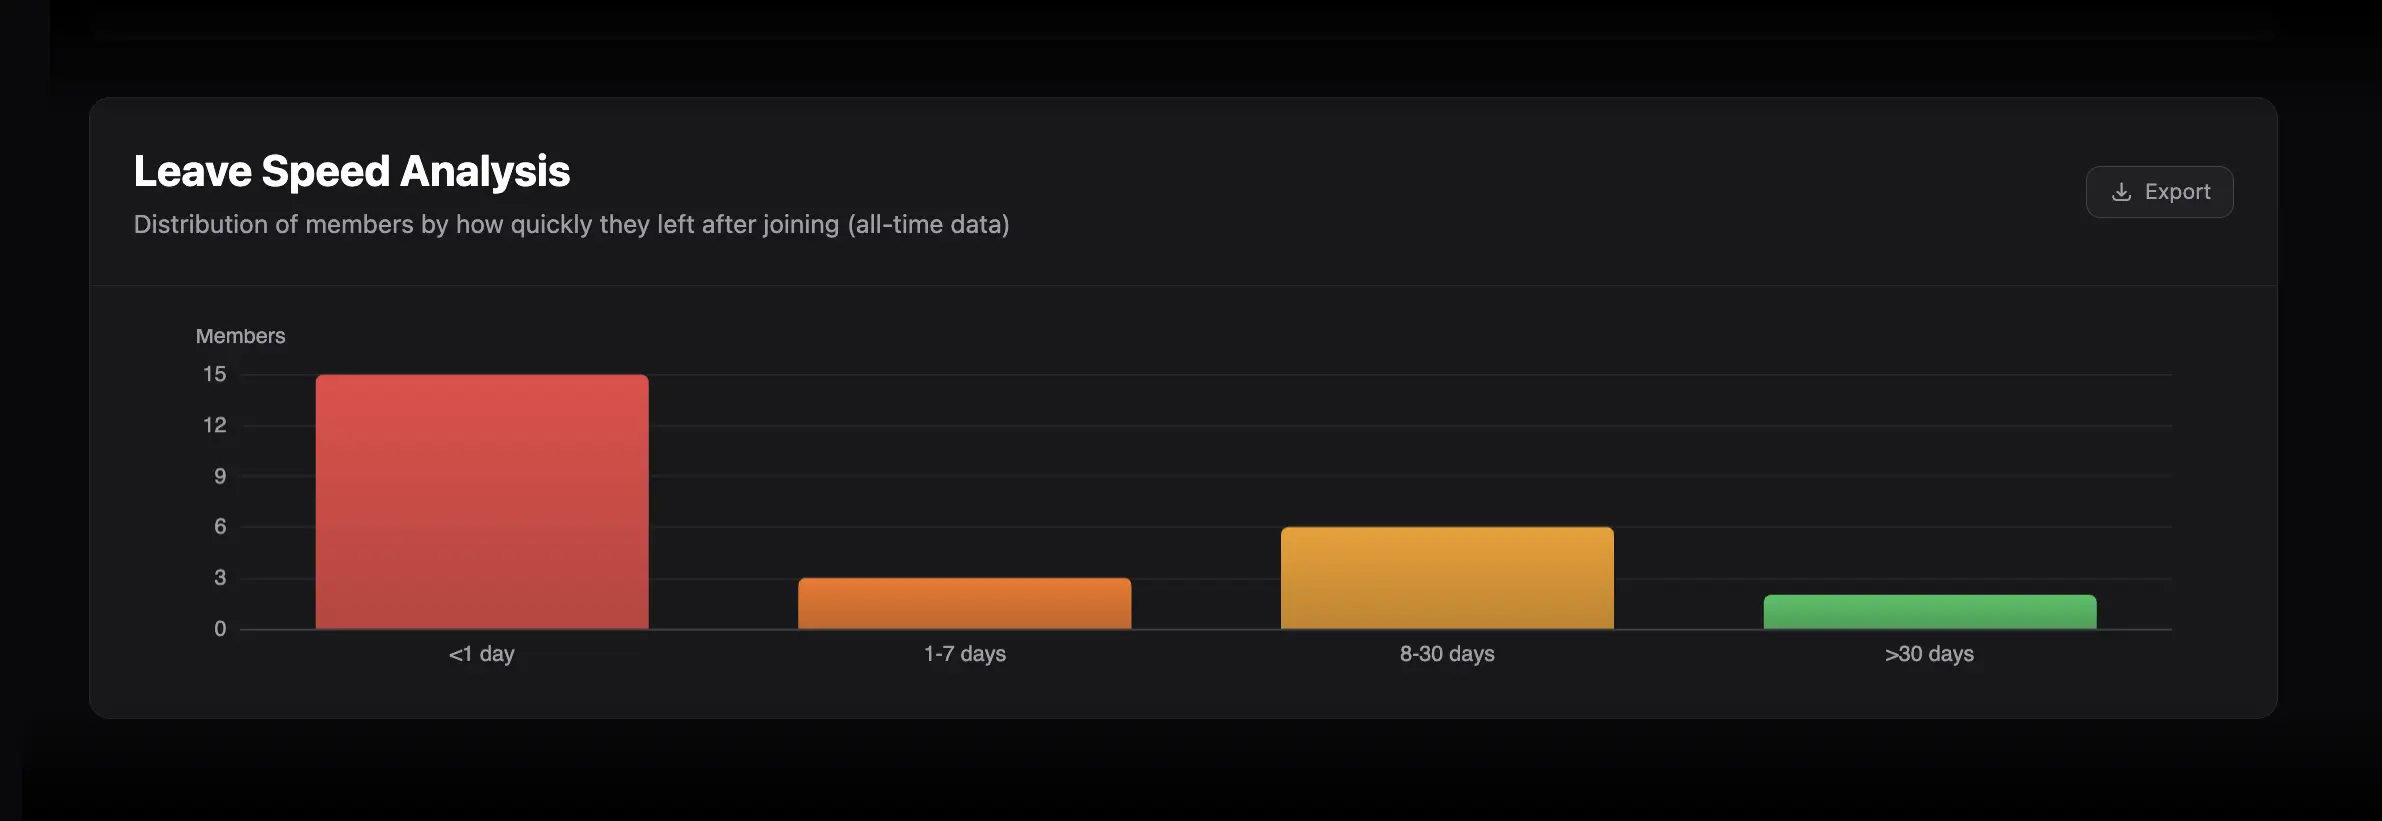
Leave Speed Analysis groups former members by how long they remained after joining:
- Less than 1 day
- 1–7 days
- 8–30 days
- More than 30 days
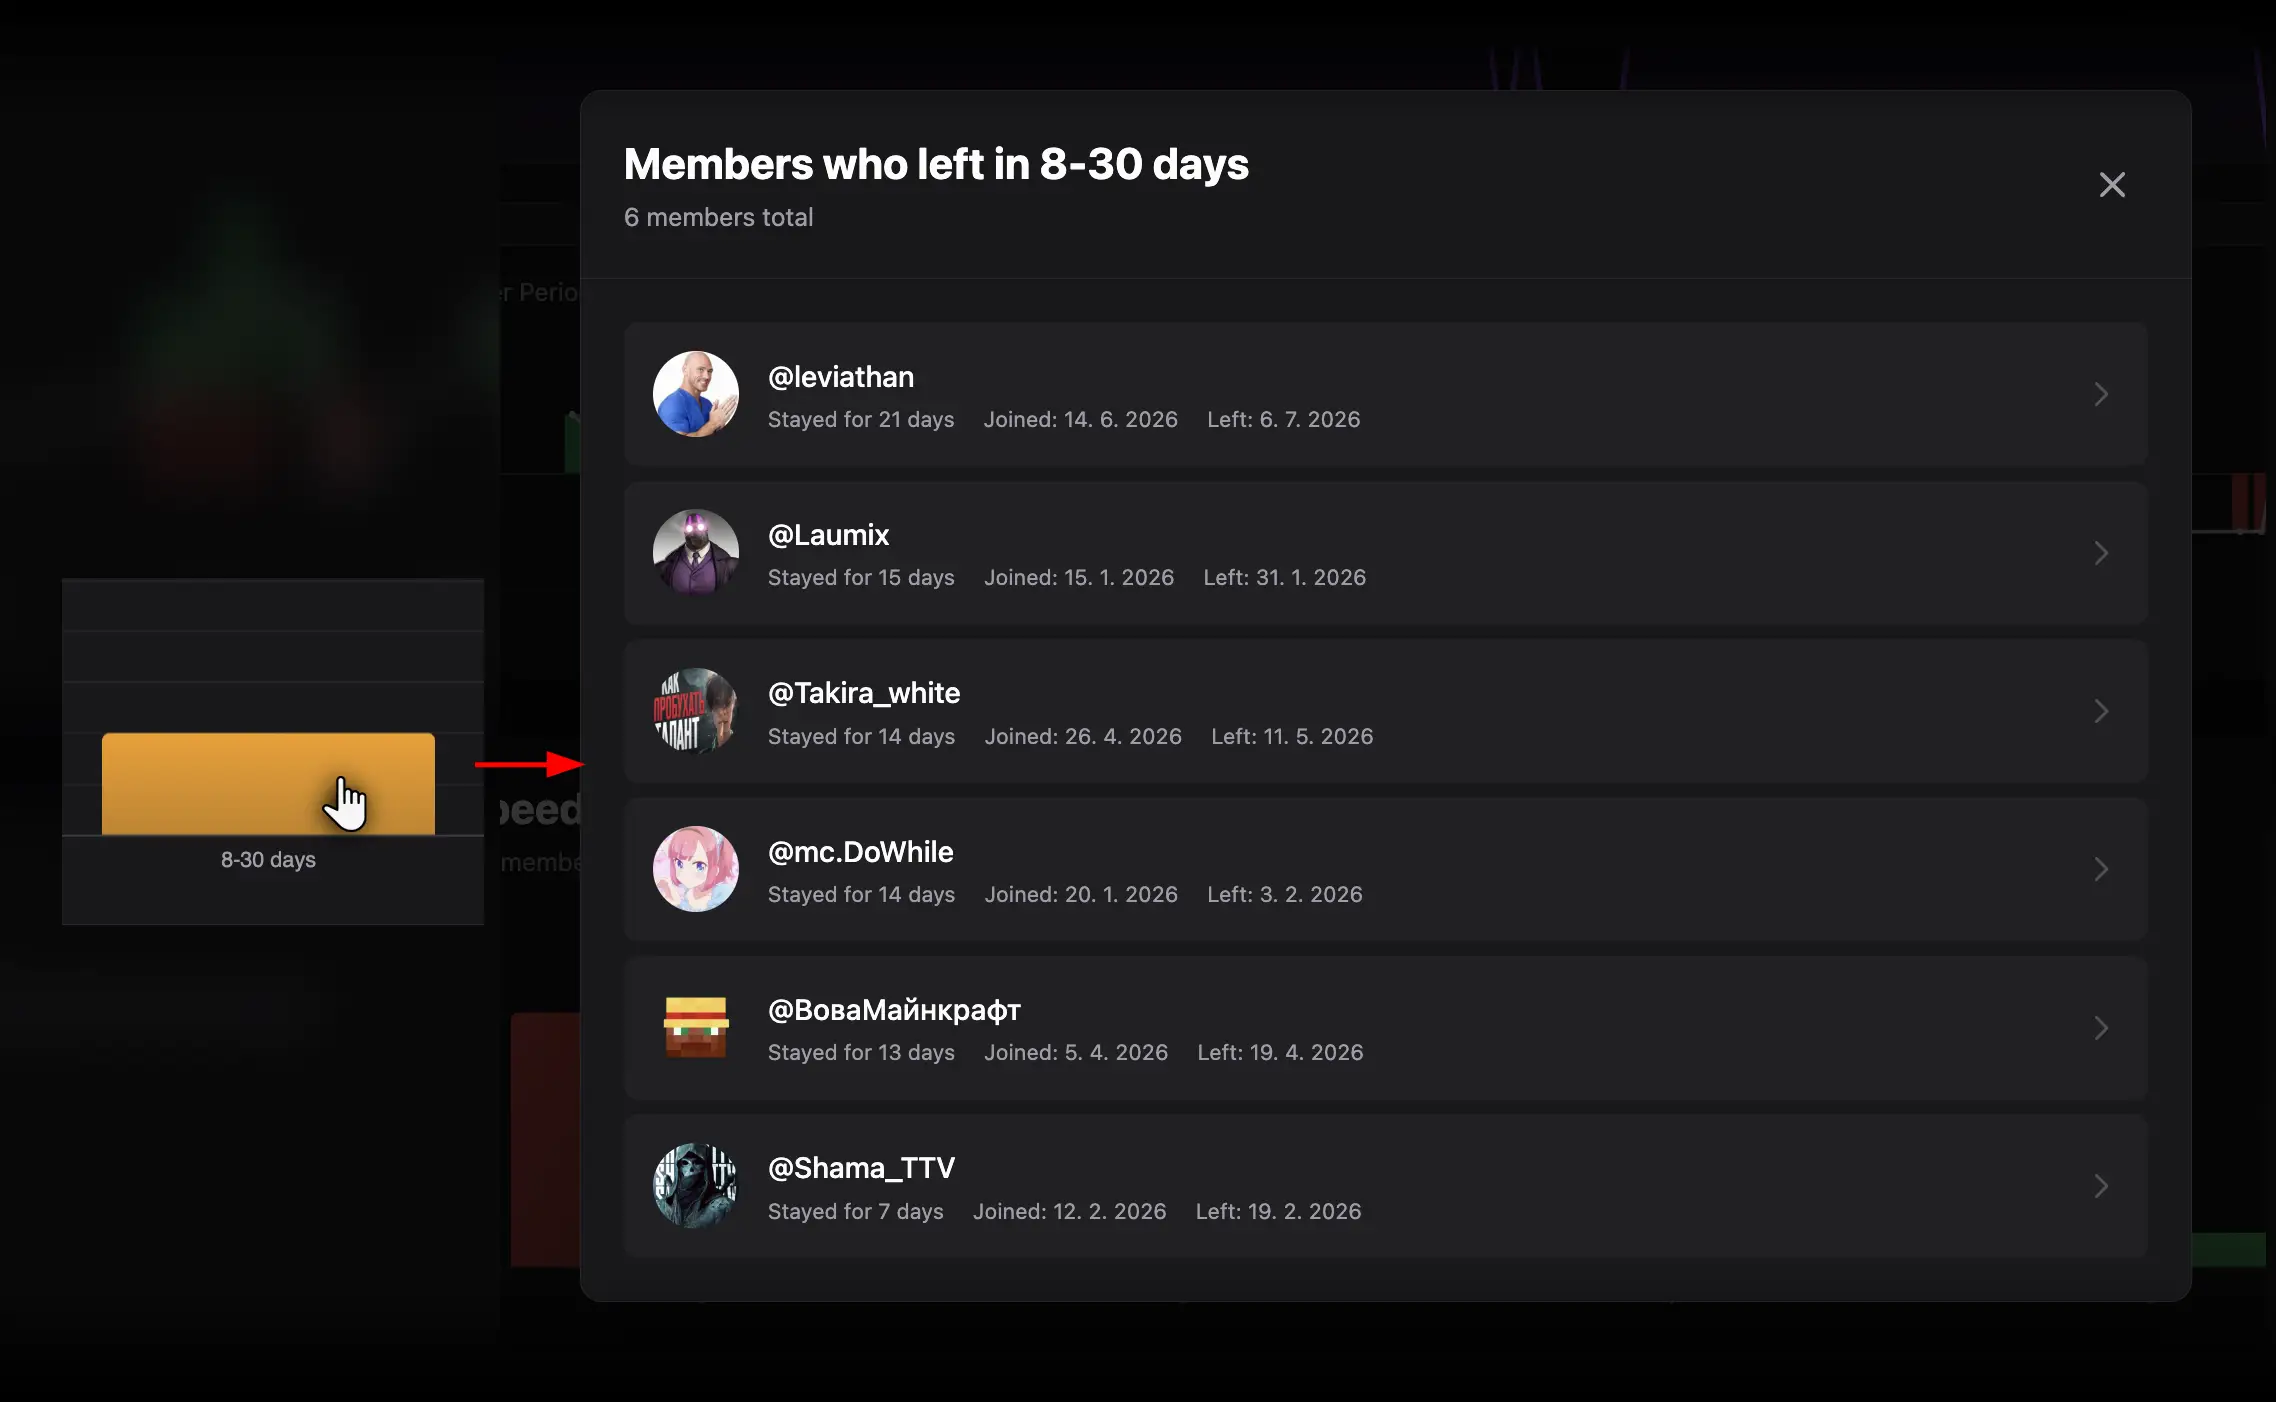
This section is always all-time and does not follow the page date range. Click a bar to see the affected members, exact stay durations, and join and leave dates. A high share in the first two buckets can indicate an onboarding, audience-fit, permission, or first-experience problem; the chart identifies the symptom, not the cause.
Useful workflows
Evaluate a campaign
Set the campaign dates, note joins and net growth, then compare the result with the previous equal-length period. Follow with Invites to identify acquisition sources and Onboarding Activity to see whether new members began participating.
Investigate a decline
Enable Best/Worst Periods, zoom into the red interval, click its leave bars, and review the departing members. Compare that period with message and voice activity before drawing a conclusion.
Measure durable growth
Do not rely on joins alone. Look for positive net growth accompanied by slower leave-speed buckets and stable or improving engagement.
Exporting
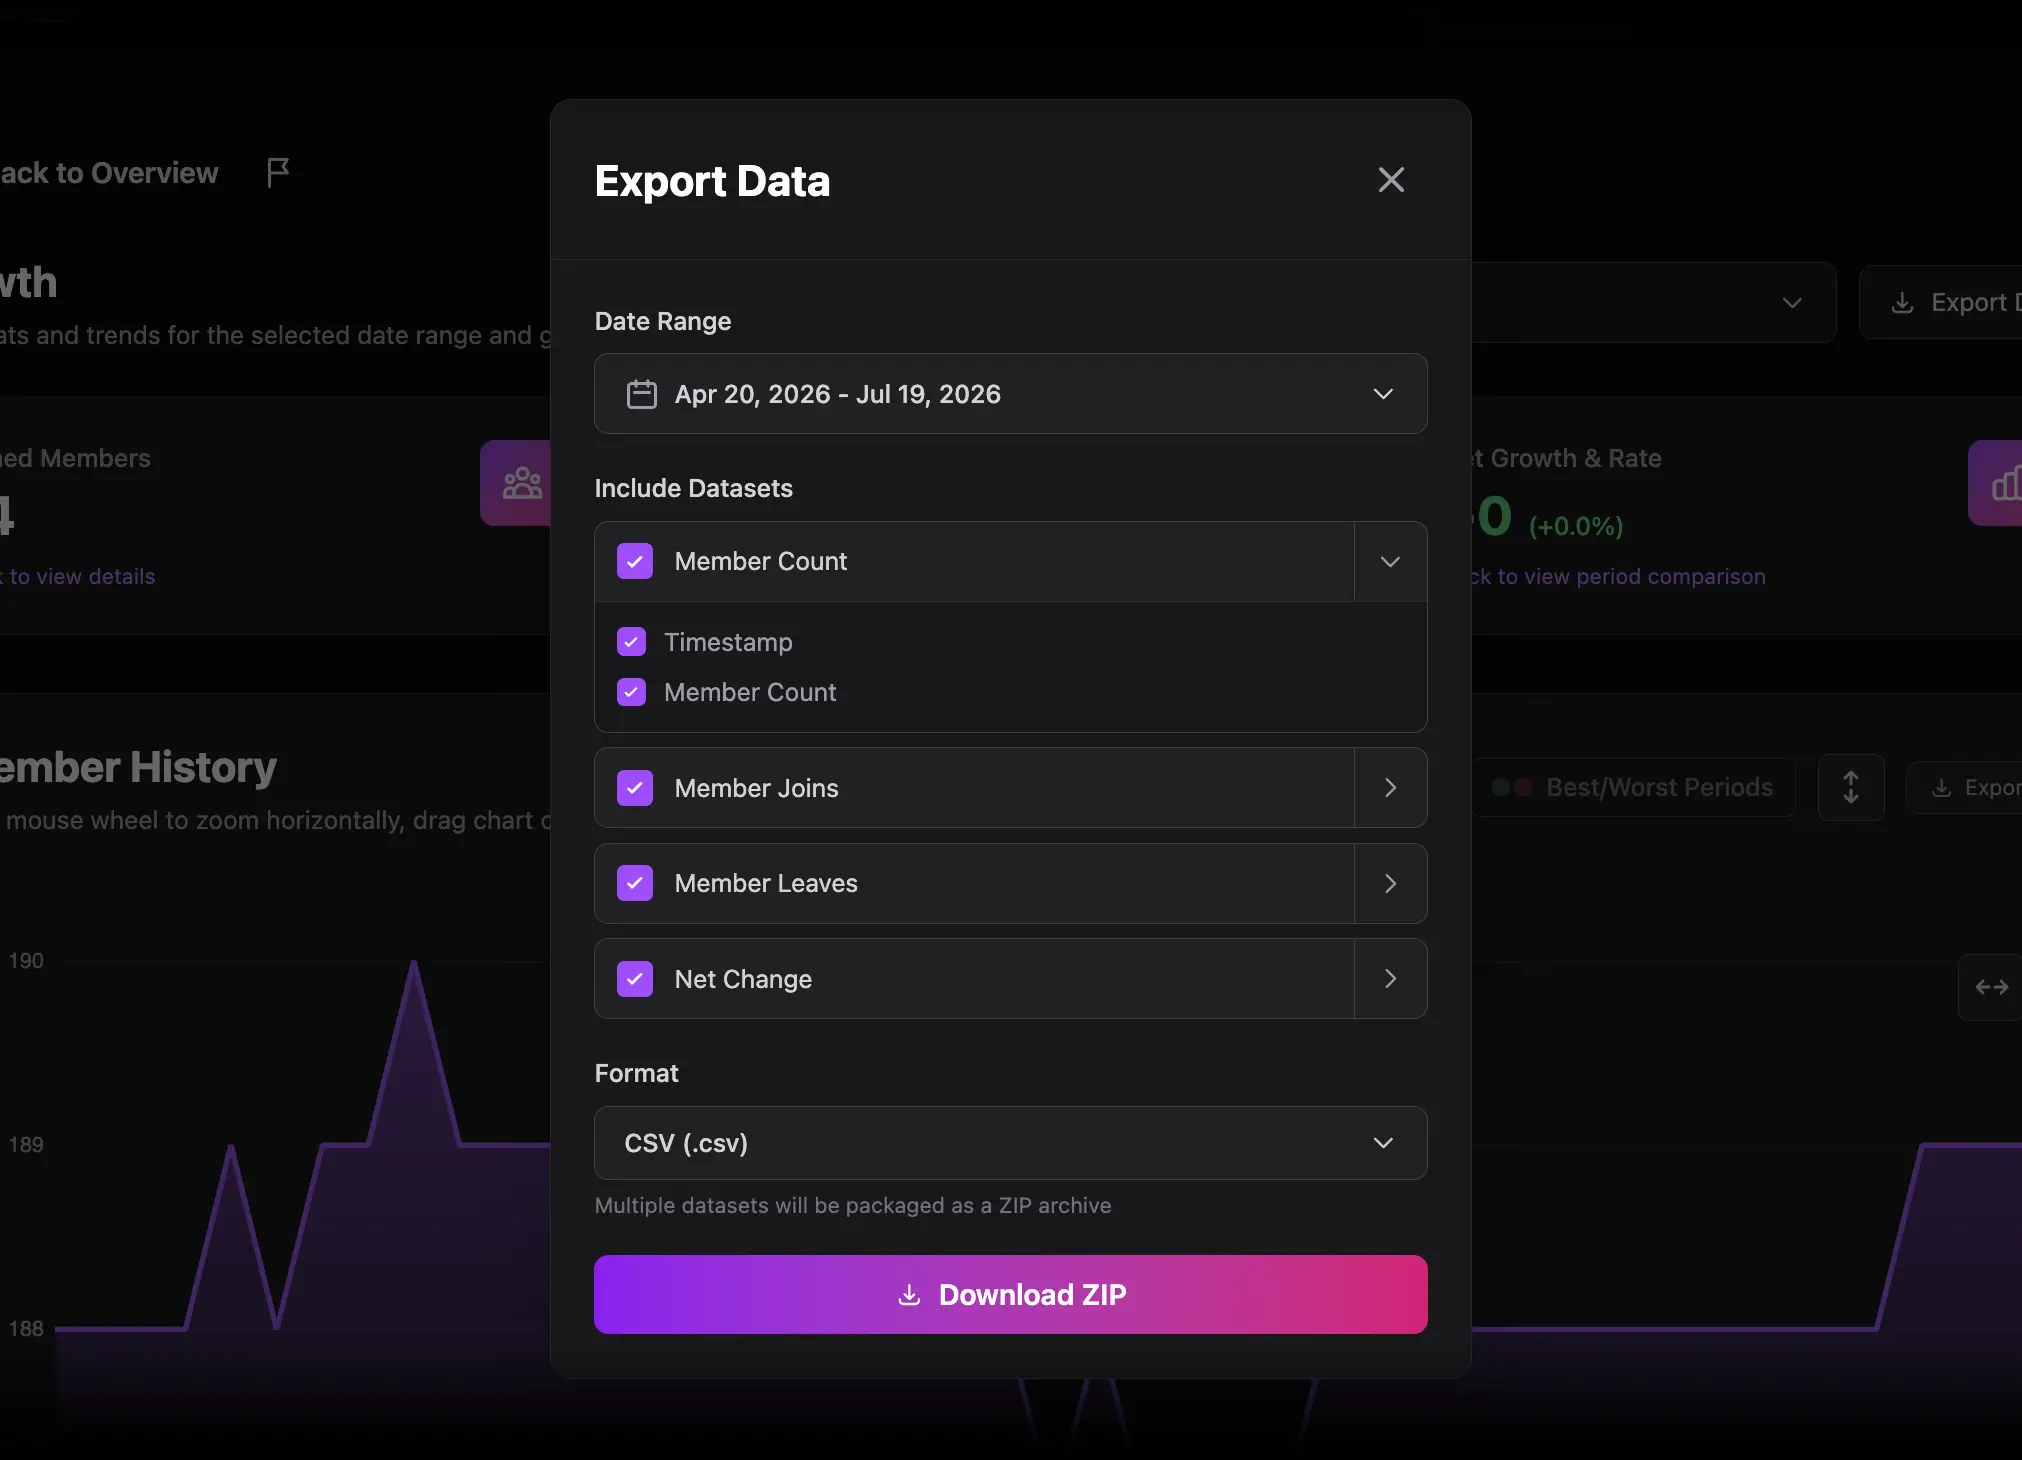
Export Data can include Member Count, Joins, Leaves, and Net Change. Chart-level Export buttons download only the relevant dataset. You can change the export date range and columns without changing the on-screen view.
Interpretation cautions
- Bot tracking begins only after the bot is connected; older or padded periods may not represent observed history.
- A small server can show a large percentage change from only a few members.
- Leave Speed is all-time, while the main chart follows the selected range.